This is the eighth in our series of posts by students on the job market this year.
Worldwide, over 800 million people are lacking energy: they are hungry. Yet far more, over 2 billion people, suffer from “hidden hunger,” micronutrient deficiencies that impair cognition, impede skeletal growth, put both mothers and infants at risk of death, and reduce life-long productivity for those who survive (Kennedy, Nantel and Shetty 2003; Horton, Alderman and Rivera 2009).
However, despite the prevalence and far-reaching ramifications of vitamin and mineral deficiencies, precise deficiency rates are difficult to estimate, and individuals rarely know their own micronutrient status. Nutritionists and policy-makers often gauge a person or populations’ micronutrient status by estimating micronutrient intake, which is constructed according to food consumption/supply data and a Food Composition Table (FCT) that gives a fixed nutrient content value for all foods (e.g., here or here). But food nutrient content is not fixed; it is a conditional distribution that shifts over space and time. Therefore, intake estimates that rely on FCTs will fail to capture heterogeneity in micronutrient intake, tend to under-estimate deficiency prevalence, and fail to detect key vulnerable populations dependent on staples with lower-than-average micronutrient content.
In my job market paper, I examine the heterogeneity of crop zinc content in Uganda, and attempt to explain the puzzling phenomenon that crops sampled from markets are far lower in zinc content than crops sampled from smallholder farms, leaving families dependent on market-purchased crops differentially vulnerable to zinc deficiency. Figure 1 illustrates this differential. These major differences are hugely important; estimated child zinc deficiency doubles (from 28 to 55 percent) when intake is calculated using the mean zinc content from market-purchased crop samples rather than from household-obtained crop samples.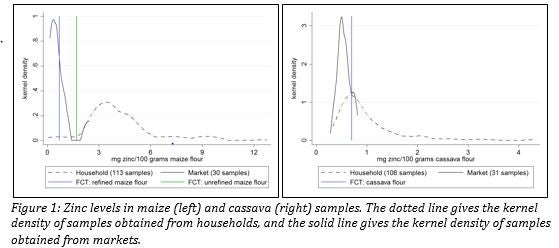
Why is the zinc content of staples at market so low? A large portion of the differential is explained by selection into marketing; a tiny minority of farmers supplies the bulk of staples at market, and these farmers grow crops that are lower in zinc content than the national average. This is largely due to spatial patterns in both crop zinc content (due to soil pH, soil nutrients, climate; more details here) and crop supply to market. These spatial patterns alone cause staples at market to be up to 30 percent lower in zinc content than the nation-wide average. It is also due to time trends in supply to the market. When particularly low-zinc farmers enjoy favorable growing conditions and supply part of their bumper crop to market, they drive crop zinc content at market even further down than normal.
Working with two datasets, I first model the production of crop zinc content on smallholder farms in order to examine the spatial patterns driving average market zinc content. I then estimate how time-varying factors (such as weather shocks) shift supply in order to explore the time trends in zinc content at market.
Spatial Patterns
To compare the zinc content of crops produced to that of crops sold, I model household-specific crop zinc content in a small but geographically dispersed dataset gathered by IFPRI and the University of North Carolina, maximizing predictive power through k-fold cross-validation. I then project zinc content for all farmers within the nationally representative Uganda LSMS-ISA panel dataset, in a manner similar to Small Area Estimation (Elbers, Lanjouw & Lanjouw 2003). This method allows me to use the crop nutrient content data in the smaller dataset, but also to make inferences at the national level about crop production and marketing over several years.
Using the LSMS-ISA data on crop sales, I simulate the expected distribution of projected zinc content at market for each of 6 staple crops, and compare that to the distribution of zinc content for all producers, for each season observed in the panel. The result mimic what was observed empirically: zinc content is expected to be significantly lower at market, and particularly during Uganda’s first agricultural season. For instance, zinc content of maize at market is as much as 16 percent lower than maize grown on farms in the first seasons of 2009-2011. Likewise, cassava at market is up to 33 percent lower in zinc than cassava grown on farms.
This finding is particular to the spatial patterns in Ugandan crops and the spatial patterns in Ugandan market supply --- together, these patterns drive crops at market to be lower in zinc content than the national average. This market vs. household differential is significant, however, and has the capacity to significantly decrease the zinc intake of children who heavily rely on market-purchased staples.
Moreover, the results suggest that estimation of zinc intake based on FCTs is biased upwards for most children, and particularly for the children who are most reliant on market-purchased staples, e.g. the urban poor. (This is because, for most crops, the FCT zinc content value is higher than the market staples zinc content value.) Thus for most children, using FCTs will lead to an under-estimate of the risk of zinc deficiency.
Time Trends
I also find that the household-market differential varies over time, suggesting that in some years market reliance is particularly damaging to nutrient intake. I explore this volatility of market nutrient content over time by modeling two factors that potentially drive staple supply to market: rainfall and temperature shocks. I do this using a Triple Hurdle Model similar to Burke, Myers, and Jayne (2015) and Bellmare and Barrett (2006), and find that temperature shocks significantly shift maize and sorghum supply to market. While the average partial effect of rainfall is insignificant, a positive temperature realization of one coefficient of variation results in 3.5 percent and 1.8 percent increases in maize and sorghum supply, respectively.
It so happens that temperature realizations in the years leading up to the UNC-IFPRI survey favored low-zinc farmers over high-zinc farmers, particularly in Uganda’s first agricultural season. This helps explain why the predicted household-market differential is larger in the 1st agricultural season than in the 2nd agricultural season, for all years observed in the LSMS-ISA data. Additionally, the trend continues in 2012 and 2013, and worsens: In the first agricultural seasons of 2009-2011, low-zinc farmers (those who fall within the 1st quartile of cereal zinc content) received temperature realizations 80% higher than those of high-zinc farmers (4th quartile of cereal zinc content). In 2012-2013, low-zinc farmers received temperature realizations 140% higher than those of high-zinc farmers.
It seems plausible, therefore, that the nutrient content of crops at market was particularly low when we sampled crops in 2013, given that temperature realizations had been so particularly “favoring” low zinc farmers in the last few years.
Policy Implications
The spatial and temporal patterns described here are Uganda-specific, of course. However, these findings suggest that we should never expect, a priori, that the nutrient content of crops at market will perfectly mirror the nutrient content of crops produced country-wide. Understanding both the production and market processes underpinning these distributions is key to crafting policies that will bring down micronutrient deficiency levels.
Some of these policies are described here. Biofortification or micronutrient-enriched fertilizers, for instance, address the spatial patterns in crop zinc production. But if certain types of farmers (e.g., those close to roads or towns) are dependent on the market for their consumption, particularly at certain times of year (e.g., lean season), then such policies will not address their needs --- or may not address their needs during the most vulnerable time periods. Trade between regions or countries can boost the nutrient content of crops at market (as observed in the US and Europe), a market-level rather than production-level intervention. At the very least, greater knowledge about the processes underpinning the heterogeneity of crop nutrient content can lead to informed and efficient government targeting when it comes to human-level interventions such as supplementation campaigns.
Leah Bevis is a PhD candidate at Cornell University.

Join the Conversation