 Coffee producers. Chiapas, Mexico
After numerous domestic and external constraints held growth back in Latin America and the Caribbean in 2019, the regional economy is projected to firm to 1.8 in 2020 as conditions in the largest economies improve and regional export demand picks up. However, the anticipated recovery will still be insufficient to offset the widening regional per capita income gap with advanced economies. Downside risks to the forecast predominate. Continued progress on the structural reform agenda will be needed to boost productivity growth and potential growth.
1. Domestic challenges constrained the region in 2019
An uncertain investment climate in Mexico, renewed financial stress in Argentina, and social unrest in Bolivia, Chile, and Ecuador contributed to a sharp slowdown of regional growth to an estimated 0.8% in 2019. Industrial activity contracted and services activity slowed in the first half of 2019 before improving somewhat in the second half.
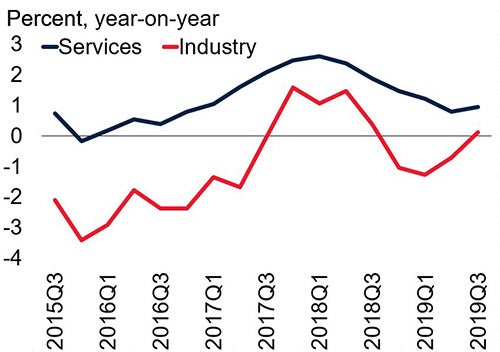
Source: Haver Analytics; World Bank. Notes: Lines show GDP-weighted averages of Argentina, Brazil, Chile, Colombia, Mexico, and Peru (90 % of regional GDP). Last observation is 2019Q3.
2. Regional export growth has slowed with global trade activity
Amid a sharp slowdown in global trade, exports from Brazil, Chile, and Peru to China (the largest export destination of all three countries) have plateaued or begun to shrink, contributing to a deceleration in regional export growth to about 1.1% in 2019, from 4.2% in 2018.
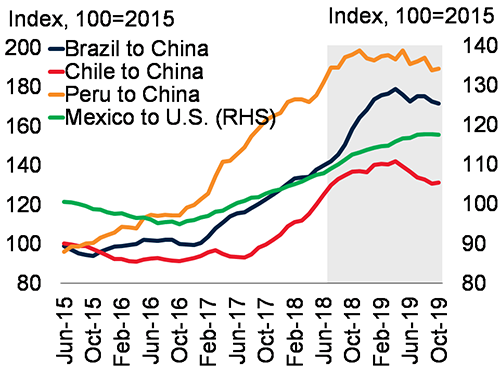
Source: Haver Analytics; World Bank. Notes: Index based on exports (in value) from Brazil, Chile and Peru to China, and from Mexico to the United States. Gray area begins when China and the United States began to increase bilateral tariffs, in July 2018. Last observation is October 2019.
3. A modest growth pickup is projected in 2020 as conditions in the largest economies improve
Better prospects in the largest economies, including from improved investor confidence and easing lending conditions in Brazil, stronger investment in Mexico, a receding contraction in Argentina as the effects of financial stress fade, and robust infrastructure investment in Colombia, will account for most of the modest projected regional growth acceleration to 1.8 % in 2020.
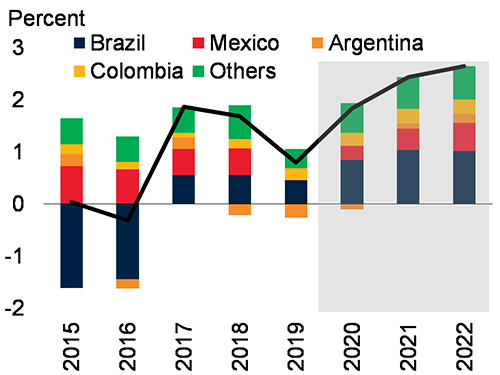
Source: World Bank. Note: Regional growth aggregate excludes Venezuela.
4. A widening of the per capita income gap with advanced economies will not be closed, and downside risks to the growth forecast abound
Sluggish growth during the forecast horizon will be insufficient to fully offset a growing per capita income gap with advanced economies since 2014 in some countries in the region. Moreover, the growth outlook is subject to significant downside risks from adverse market responses to weak fiscal conditions, deeper-than-expected negative spillovers from key economies, and disruptions from natural disasters.
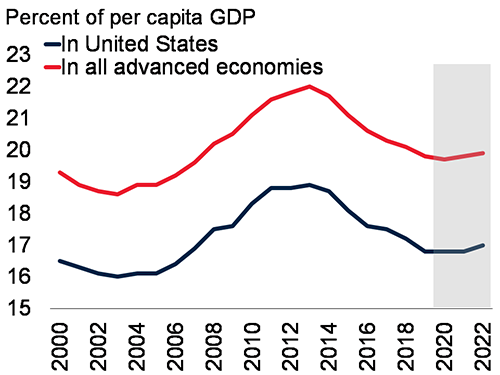
Source: World Bank. Notes: Per capita GDP is calculated as the sum of GDP in the countries in the indicated groups divided by the sum of the population in the same country groups.
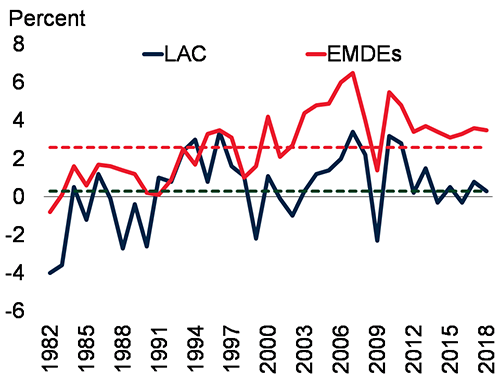
5. Continued progress on structural reforms is needed to boost medium- and long-term prospects
Progress on the structural reform agenda—in competition and innovation, trade linkages, quality of education, labor market efficiency, and institutional quality—is key to boosting longstanding low labor productivity growth and raising potential growth in the region.
Source: Conference Board; Penn World Tables; World Bank (World Development Indicators).
Notes: Productivity is defined as labor productivity (real GDP per person employed). Country group aggregates for a given year are calculated using constant 2010 U.S. dollar GDP weights. Data for multiyear spans shows simple averages of the annual data. Sample includes 25 LAC countries and 127 EMDEs. Dotted lines show 1981-2018 averages.

Join the Conversation