How has development transformed over the past decade? What ideas have changed the way we think about issues like education, migration, microfinance, and inequality? Since 2013, the World Bank’s Policy Research Talks have taken research beyond the regression tables to dive into policy impact, exploring ideas that can change the way that the Bank and the broader global community do development. From the now famous elephant graph to themes that became central to future World Development Reports, many early-stage ideas from the wonky world of research and data first entered the public square through this series.
Are private schools just for the rich?
It’s no surprise that around the world, the rich are more educated than the poor. In efforts to address inequality of educational attainment, are private schools a boon or a curse? It stands to reason that the fees charged by private schools would deter access by the poorest—and yet, the LEAPS research project, co-led by Jishnu Das (formerly an economist in the research department and now a professor at Georgetown University) showed just the opposite.
In Figure 1, we see the extraordinary growth of private schools in Pakistan—from 3,300 in 1982 to 32,000 in 2000. And the growth included many of the rural poor. In fact, by the end of the 1990s, nearly 10 percent of children in the poorest deciles were studying in private schools. In his Policy Research Talk, Das shared that test scores in private schools were higher, civic values were no worse, and overall costs to parents and society were lower.
What made this possible? For one thing, the schools were cheap—the median rural private school charged less than a dime (six rupees) a day. While Das and his coauthors’ work hasn’t ended the debate around the role of the private sector in education—see, for instance, the mixed and contentious results emerging from Liberia’s experiment with outsourcing schools—it clearly demonstrated that under certain conditions, private schools really can serve the poor. At least, at a dime a day.
Figure 1: The Growth of Private Schools in Pakistan

Resources: Presentation | Working Paper | Journal Article | LEAPS
Bonus factoid: Das’s work also helped undercut a false narrative in the media that madrassas were growing exponentially in Pakistan. In fact, there were fewer kids in religious schools in Pakistan than in the U.S. See: https://www.economist.com/asia/2005/05/19/madrassa-maths.
Is global migration on the rise?
If you had to guess, what percentage of the world’s population are international migrants, and how has that figure changed in recent decades? While recent news coverage might indicate otherwise, migrants today make up just a little more than 3 percent of the world’s population—and that number has held steady for the past sixty years.
This consistently low level of migration is even more surprising given that the huge differences in wages between rich and poor countries can translate into large, long-term wage gains for migrants. In a Policy Research Talk on global migration, Çağlar Özden showed that depending on a migrant’s occupation, education, and location, real wages can be four to 10 times higher than in their country of origin.
Özden’s research into the causes and consequences of global migration culminated in a 2018 Policy Research Report on Moving for Prosperity: Global Migration and Labor Markets, which proposed innovative policy measures to better manage economic concerns around migration. The Economist took note of some of these suggestions in its recent special report on migration: for one, rich country governments could replace visa quotas with taxes on immigration and spend the tax receipts on a popular cause. While few countries have tried this approach to date—Singapore being a notable exception—there’s no time like the present for new approaches to a seemingly intractable global problem.
Figure 2: The World Migrant Stock as a Share of World Population
Resources: Presentation | Video | Working Paper | Journal Article | Policy Research Report
"Is our children learning?"
Back at the turn of the century, the Millennium Development Goal for education focused on getting kids into and through primary school. But in the last decade, it’s become clear that school attendance isn’t nearly enough. Reviewing an experiment on the impact of scholarships on school attendance in Cambodia, Deon Filmer pointed out that despite significant increases in enrollment, actual levels of learning in mathematics and vocabulary didn’t budge.
Was it poor pedagogy? Were students just not paying attention? Evidence from another part of the world suggested an even more alarming possibility: teachers don’t actually know the subject they’re teaching. Figure 3 below—based on data from the Service Delivery Indicators—shows that in Kenya, Senegal, and Tanzania, one in four teachers lack minimum levels of knowledge in mathematics. In Uganda, it’s the majority—two out of every three teachers. And that’s when the teachers even show up—Kenya, Tanzania, and Uganda all record teacher absence rates of around 50 percent.
Filmer went on to co-author the 2018 World Development Report, “Learning to Realize Education’s Promise”, which prominently featured the issue of “schooling without learning”.
Figure 3. Severe Shortfalls in the Delivery of Education Services

Resources: Presentation | Video | Working Paper | Journal Article | Making Schools Work: New Evidence on Accountability Reforms | World Development Report | Service Delivery Indicators
Is microfinance the answer to life, the universe, and everything?
Back in 2006, when Muhammad Yunus won the Nobel Prize for pioneering microfinance through his innovative Grameen Bank, the concept had already taken the development world by storm. People saw microfinance as more than just another development intervention—rather, it was hailed as a bottom-up, participatory approach to development that could replace the cumbersome and bureaucratic approach of slow-moving aid agencies. A decade later (and just three years away from winning the Nobel Prize herself), Esther Duflo concluded: “These loans do help, but the changes are not transformative, certainly not transformative enough to justify charitable donations to the standard microcredit model.”
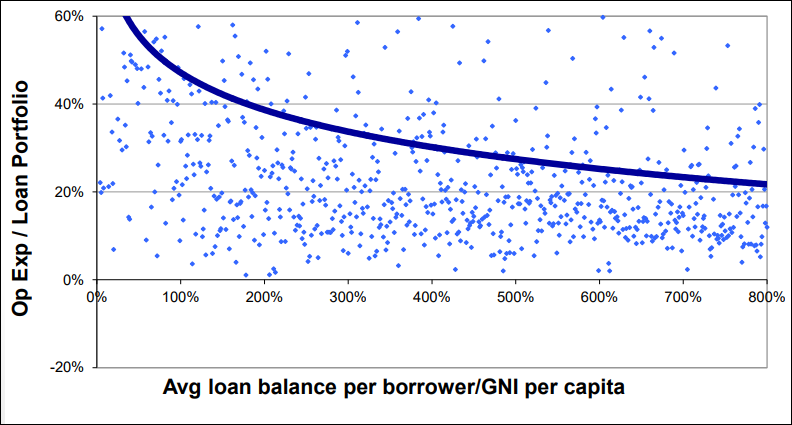
Part of the tarnish on the so-called silver bullet was the inherent tension between reaching the poor and achieving financial sustainability, as Bob Cull explained in a 2015 Policy Research Talk. The small transaction sizes of loans to the poor entail a higher cost for each loan (Figure 4), meaning that subsidies are hard to avoid if organizations want to effectively support the poorest clients. Complicating matters further, the large bulk of subsidies don’t even go to the poorest: the most commercialized institutions give their customers an average subsidy of US$275, compared to an average US$23 from NGOs, which tend to focus on women and the poor.
Figure 4: Smaller Loans Entail Higher Costs
Resources: Presentation | Video | Working Paper | Journal Article
The elephant of inequality
It’s one of the most famous charts in economics, covered by the New York Times, BBC, and Vox, among others. But it first appeared in the public eye near the end of a somewhat technical lecture on global income inequality, presented by Branko Milanovic—an economist in the research department for over two decades and now at the City University of New York. This early iteration of the elephant graph, co-authored with Christoph Lakner, captures real income growth across the deciles of the global income distribution.
The elephant tells us that the big winners from intense globalization between 1988 and 2008 were the global “middle class”—citizens of China and India in particular—and above all, the wealthiest top 1 percent. While they saw large growth in their incomes, the incomes of the less well off in rich countries stagnated. The single chart captured the simmering tensions of a global economy that simultaneously produced unprecedented reductions in extreme poverty while also leading to growing levels of inequality in richer countries. Given the elephantine scope of the problem, it’s once again to the brilliance of mousy researchers that we’ll be turning in this decade for new ideas, new experiments, and new solutions for development.
Figure 5: Real Income Growth at Various Percentiles of the Global Income Distribution, 1988-2008 (in 2005 PPPs) – aka “The Elephant Graph”

Resources: Presentation | Video | Working Paper | Journal Article
Stay tuned for Part II of the series, where we’ll cover five more transformative graphs from the past decade. In the meantime, check out past and future Policy Research Talks and explore the Bank’s trove of development data to learn more about the latest ideas and numbers in development.


Join the Conversation