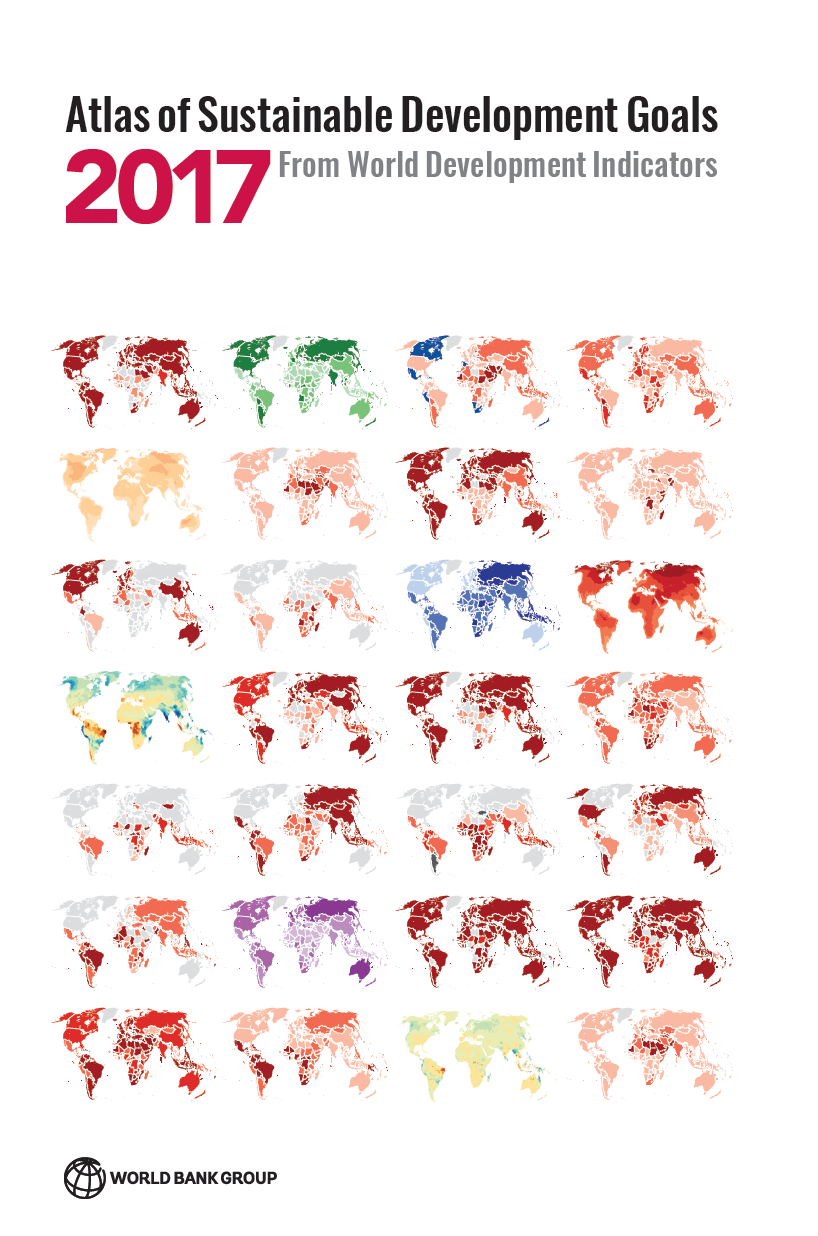
 The World Bank is pleased to release the 2017 Atlas of Sustainable Development Goals. With over 150 maps and data visualizations, the new publication charts the progress societies are making towards the 17 SDGs.
The Atlas is part of the World Development Indicators (WDI) family of products that offer high-quality, cross-country comparable statistics about development and people’s lives around the globe. You can:
- View the SDG Atlas online or download the PDF publication (150Mb)
- Access the WDI statistical tables and interactive SDG Dashboard
- Download and query the WDI database.
The 17 Sustainable Development Goals and their associated 169 targets are ambitious. They will be challenging to implement, and challenging to measure. The Atlas offers the perspective of experts in the World Bank on each of the SDGs.
Trends, comparisons + country-level analysis for 17 SDGs
For example, the interactive treemap below illustrates how the number and distribution of people living in extreme poverty has changed between 1990 and 2013. The reduction in the number of poor in East Asia and Pacific is dramatic, and despite the decline in the Sub-Saharan Africa’s extreme poverty rate to 41 percent in 2013, the region’s population growth means that 389 million people lived on less than $1.90/day in 2013 - 113 million more than in 1990
Note: the light shaded areas in the treemap above represent the largest number of people living in extreme poverty in that country, in a single year, over the period 1990-2013.
Newly published data, methods and approaches for measuring development
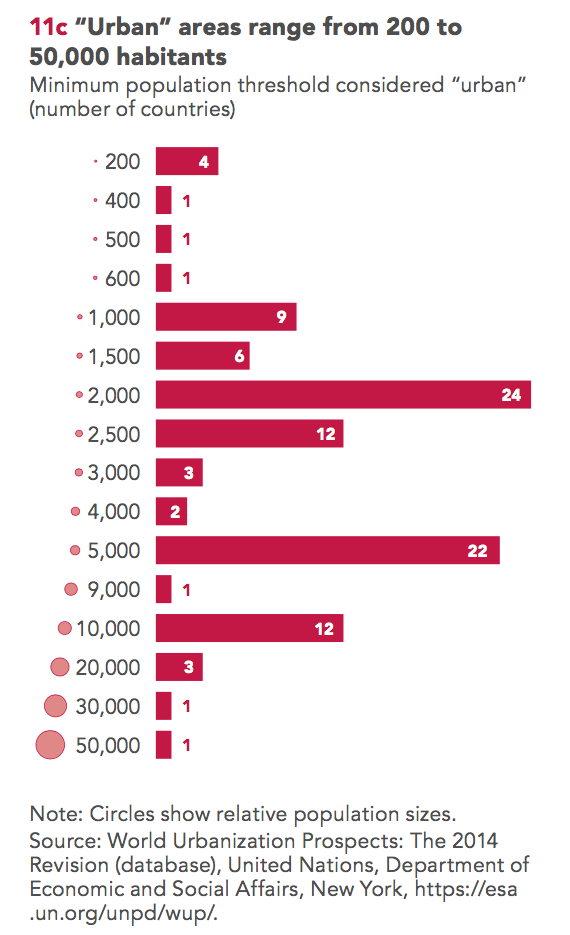
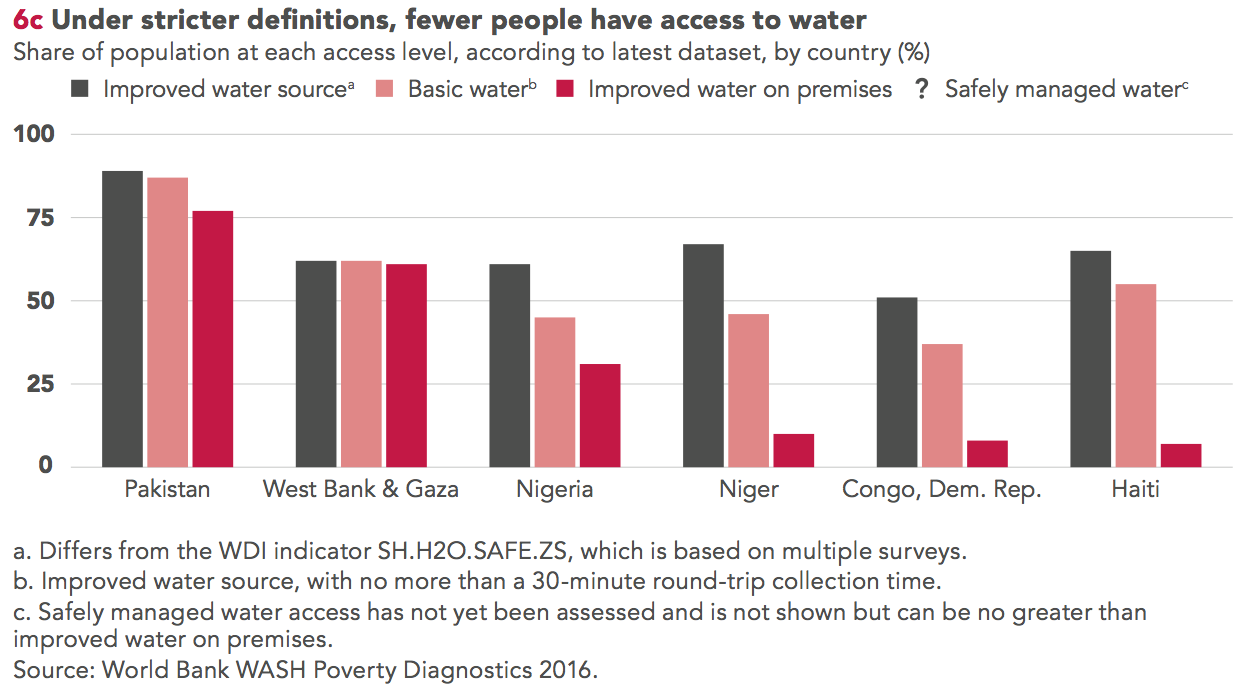
The Atlas includes data that are being published in the WDI for the first time, and discusses various methodological issues. For example, there’s now data on access to clean cooking fuels and technologies, and there are discussions on refining measurements of access to clean water, access to electricity, and establishing better definitions for the term “urban”
It discusses new methods to measure SDG indicators related to universal health care, securing land rights, measuring road accessibility in rural areas. These are so-called “Tier 3” SDG indicators because of new or untested methodologies and insufficient data coverage.
Chapter 11 discusses how the terms “urban” and “rural” have no consistent international definitions in spite of being routinely used to describe environments and the lives of those within them.
Chapter 6 presents data on access to water, and how measurement in this area is evolving. The “unimproved–improved” water source distinction is being replaced by “safely managed” services in a new monitoring framework.
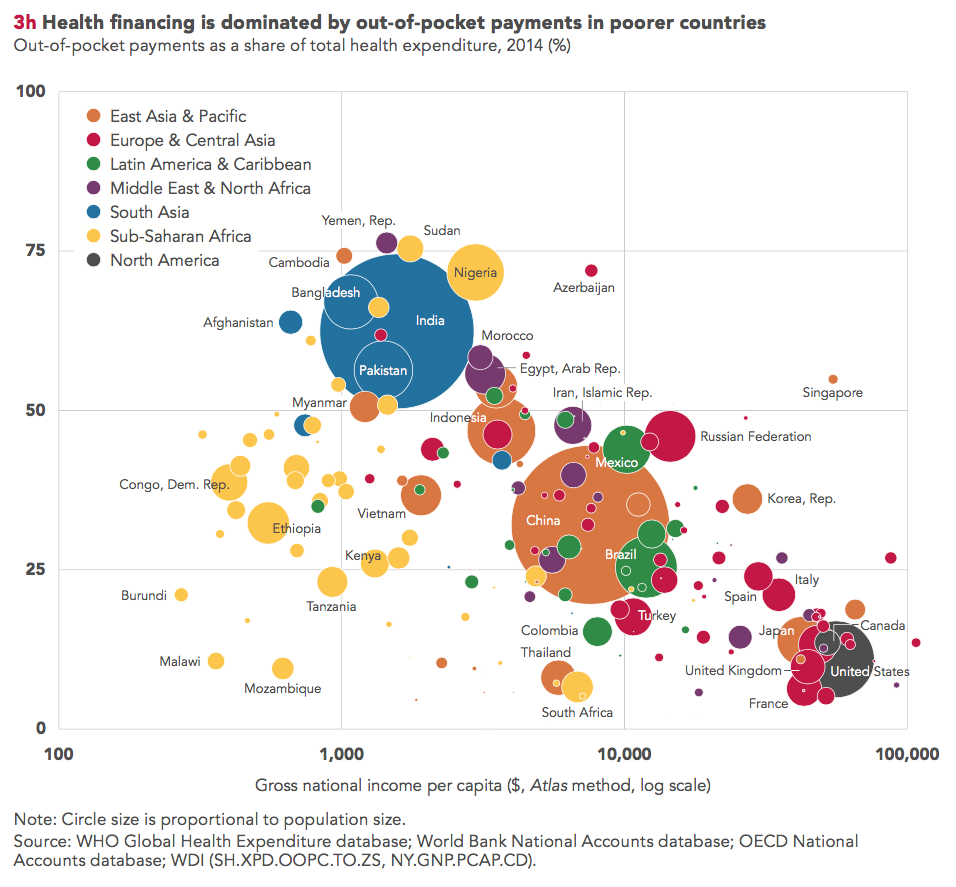
In Chapter 3, data from the WHO, OECD and World Bank are combined to show that health care financing in many low- and middle-income countries is still dominated by high out-of-pocket expenditures.
The work of a global partnership of statistics professionals
The Atlas of Sustainable Development Goals draws on World Development Indicators, a database of over 1,400 indicators for more than 220 economies, many going back more than 50 years. It relies on the work of national and international statistical agencies around the world. The professionals working in these agencies play a crucial role in measuring and quantifying the development process, so that we can all make better decisions about our lives and the scarce resources we all manage.
From the World Bank, the Atlas presents the perspective of subject matter experts in our Global Practices and Cross-Cutting Solution Areas and of data experts in the World Bank Data team. We’ve worked together to share the best of our institution’s knowledge and data in a manner we hope is engaging, understandable, and that ultimately informs the development community’s thinking.
Accessing the data
All the data in World Development Indicators and The Atlas is available completely free of charge, as part of the World Bank’s Open Data Initiative. A complete list of tools to access, explore, and interact with WDI 2017 and the SDG Atlas are available at data.worldbank.org/wdi and include:
-
The World Bank’s main multilingual data website: data.worldbank.org
-
The Interactive Sustainable Development Goals Dashboard at: data.worldbank.org/sdgs
-
Bulk download files of the WDI dataset in CSV and XLS formats, direct access via our API and via third party API wrappers for popular languages including Python, STATA and R.
-
The DataBank query tool which allows users to create, save, and share tables, charts and maps, and embed them on webpages: databank.worldbank.org
-
Statistical tables and metadata for countries, geographic regions and income groups presented by WDI section: wdi.worldbank.org/tables
-
The Data Helpdesk which responds to frequently asked questions about World Bank data and lets users submit new questions: datahelpdesk.worldbank.org/
You can follow future blogs based on the WDI and the SDG Atlas here on the The Data Blog, and keep up to date with our latest news via @worldbankdata on Twitter.


Join the Conversation