Developers, analysts and researchers often use our data through the APIs we provide. We’ve written about accessing World Bank data in Stata in the past, but I’m going to take a moment to survey the other language-specific libraries that I know of. From now on, unless I state otherwise, by “API”, I’m referring to our development indicators API.
I’ll list the libraries first, and then show some examples with a couple of them:
-
Python: The wbdata module by Oliver Sherouse offers easy access to all the data in our APIs. It also plays nicely with Wes McKinney’s superb ‘pandas’ analysis library. I’m less familiar with Matthew Duck’s wbpy module but it appears to offer similar functionality and also provides access to the Climate Data API.
Edit: Vincent notes in the comments below that he's ported his R package to Python and it is now integrated directly in the Pandas library as an I/O module. -
R: The WDI module by Vincent Arel-Bundock offers convenient access to the data in our API and opens the door to using it with the awesome ggplot2 graphing library. You can also access the Climate Data API in R with rWBclimate.
Edit: Jesse Piburn has released the wbstats module for R which is also available on CRAN
-
Ruby: The world_bank_ruby gem by Justin Stoller has some nice features for bringing our data into Ruby.
-
Stata: The wbopendata module byJoão Pedro Azevedo offers access to all our data, and the worldstat modules by Damian C. Clarke builds on it to add charting and mapping features.
In case you’re not familiar with them, Python and Ruby are popular general-purpose programming languages, and Stata and R are programming environments optimised for statistics. They’re all widely used in the business and academic worlds, and the modules above help users working with those languages to connect to the World Bank Development Indicators API and access our latest data.
What are these modules doing?
Our indicators API provides a RESTful interface onto our data, and it supports basic querying using selection parameters. The API calls return data or metadata in either XML or JSON formats. All the modules above are “wrappers” for this simple interface. They provide language-specific functions for the searching and querying our API supports, and in some cases, the modules load our data into specific data structures the languages support - DataFrames in the case of R and both dicts and pandas DataFrames in the case of Python.You can read more about our APIs in the developer documentation. I’ll write more about the APIs another time, for now, let’s try out some of these modules.
Plotting with Python
The wbdata module has very good documentation. As it’s on PyPi, assuming you already have a Python environment set up, you can just install it with “pip install wbdata”.
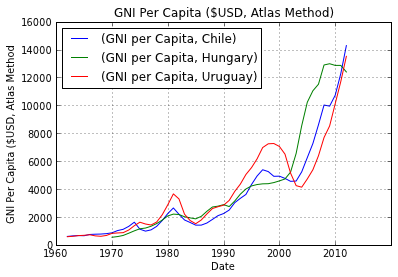
Now we’re ready to grab some data and plot it. I want to see how the GNI per capita of Chile, Hungary and Uruguay has changed over time. I’ll include some code and explanation below but you can see the whole thing more easily in this IPython Notebook.Which runs and produces this plot:

This is just a simple example, but once your data are in the pandas DataFrame (“df” above) you can subject them to any analyses and transformations that you can think of.
As an aside, if you’re a Python user and haven’t tried IPython and notebooks yet, you really should! I find it’s a great way to share code, analysis and results, and plan to use it much more as a communications tool in the future.
Plotting with R
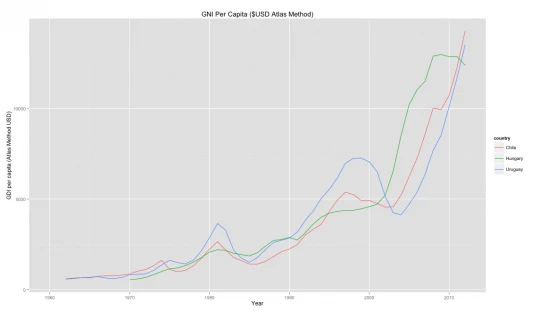
OK, let’s do the same thing with R. Fortunately, it’s even easier. To install the WDI module, just run “install.packages('WDI')” from the R prompt. Again you should read the documentation on github for information on how to search and filter for data but since we want the same as above, the code to get the data and produce the plot is:
Which runs and produces this plot:

Again, this is just a simple example using the default options, but once your data are in R, there’s a world of analysis you can do, but I’ll leave that for now.
Plotting with Ruby and Stata
I won’t do the same examples with Ruby and Stata, largely because they’re pretty similar, I’ve never plotted a chart in Ruby(!), and I don’t have Stata installed on my machine. You should be able to figure it out from the documentation above. If not - leave a comment or give @worldbankdata a shout and we’ll see what we can do.
Getting data in other languages
If you’re not using any of the languages above (we don’t have as many libraries as treasury.io...) it’s still pretty easy to use the raw API calls listed above and then deal with the JSON or XML you get back. I’ll do a little tour of the API from this perspective in the future, but for now, the documentation should get you started.
I hope you found this to be a useful intro. If you know of any other libraries that connect to our APIs, let me know, and if you have any other thoughts, leave them in the comments!


Join the Conversation