Poverty reduction consistently ranks among the most prioritized tasks of developing countries as well as the international community. Indeed, the Sustainable Development Goals (SDGs) recently adopted by the United Nations General Assembly call for eliminating poverty by 2030 in its very first goal. A good understanding about poverty trends and dynamics could result in more efficient policies and better use of resources. For example, social protection programs may be most suitable to prevent vulnerable households from falling into poverty, but are not the best options to fight a situation of entrenched chronic poverty.
Several questions typically come up in the context of poverty measurement. One set of questions concerns, unsurprisingly, how best to track the trends of poverty over time? Put differently, how do we know which trajectory country A’s poverty is on: is it upward, downward, or does it remain flat over time? The other set of questions are related to the composition of poverty transitions over time. In particular, what is the proportion of the poor in one period that remain poor (i.e., chronic poverty) or escape poverty (i.e., upward mobility) in the next period? Or what is the proportion of the non-poor that fall into poverty (i.e., downward mobility) in the next period?
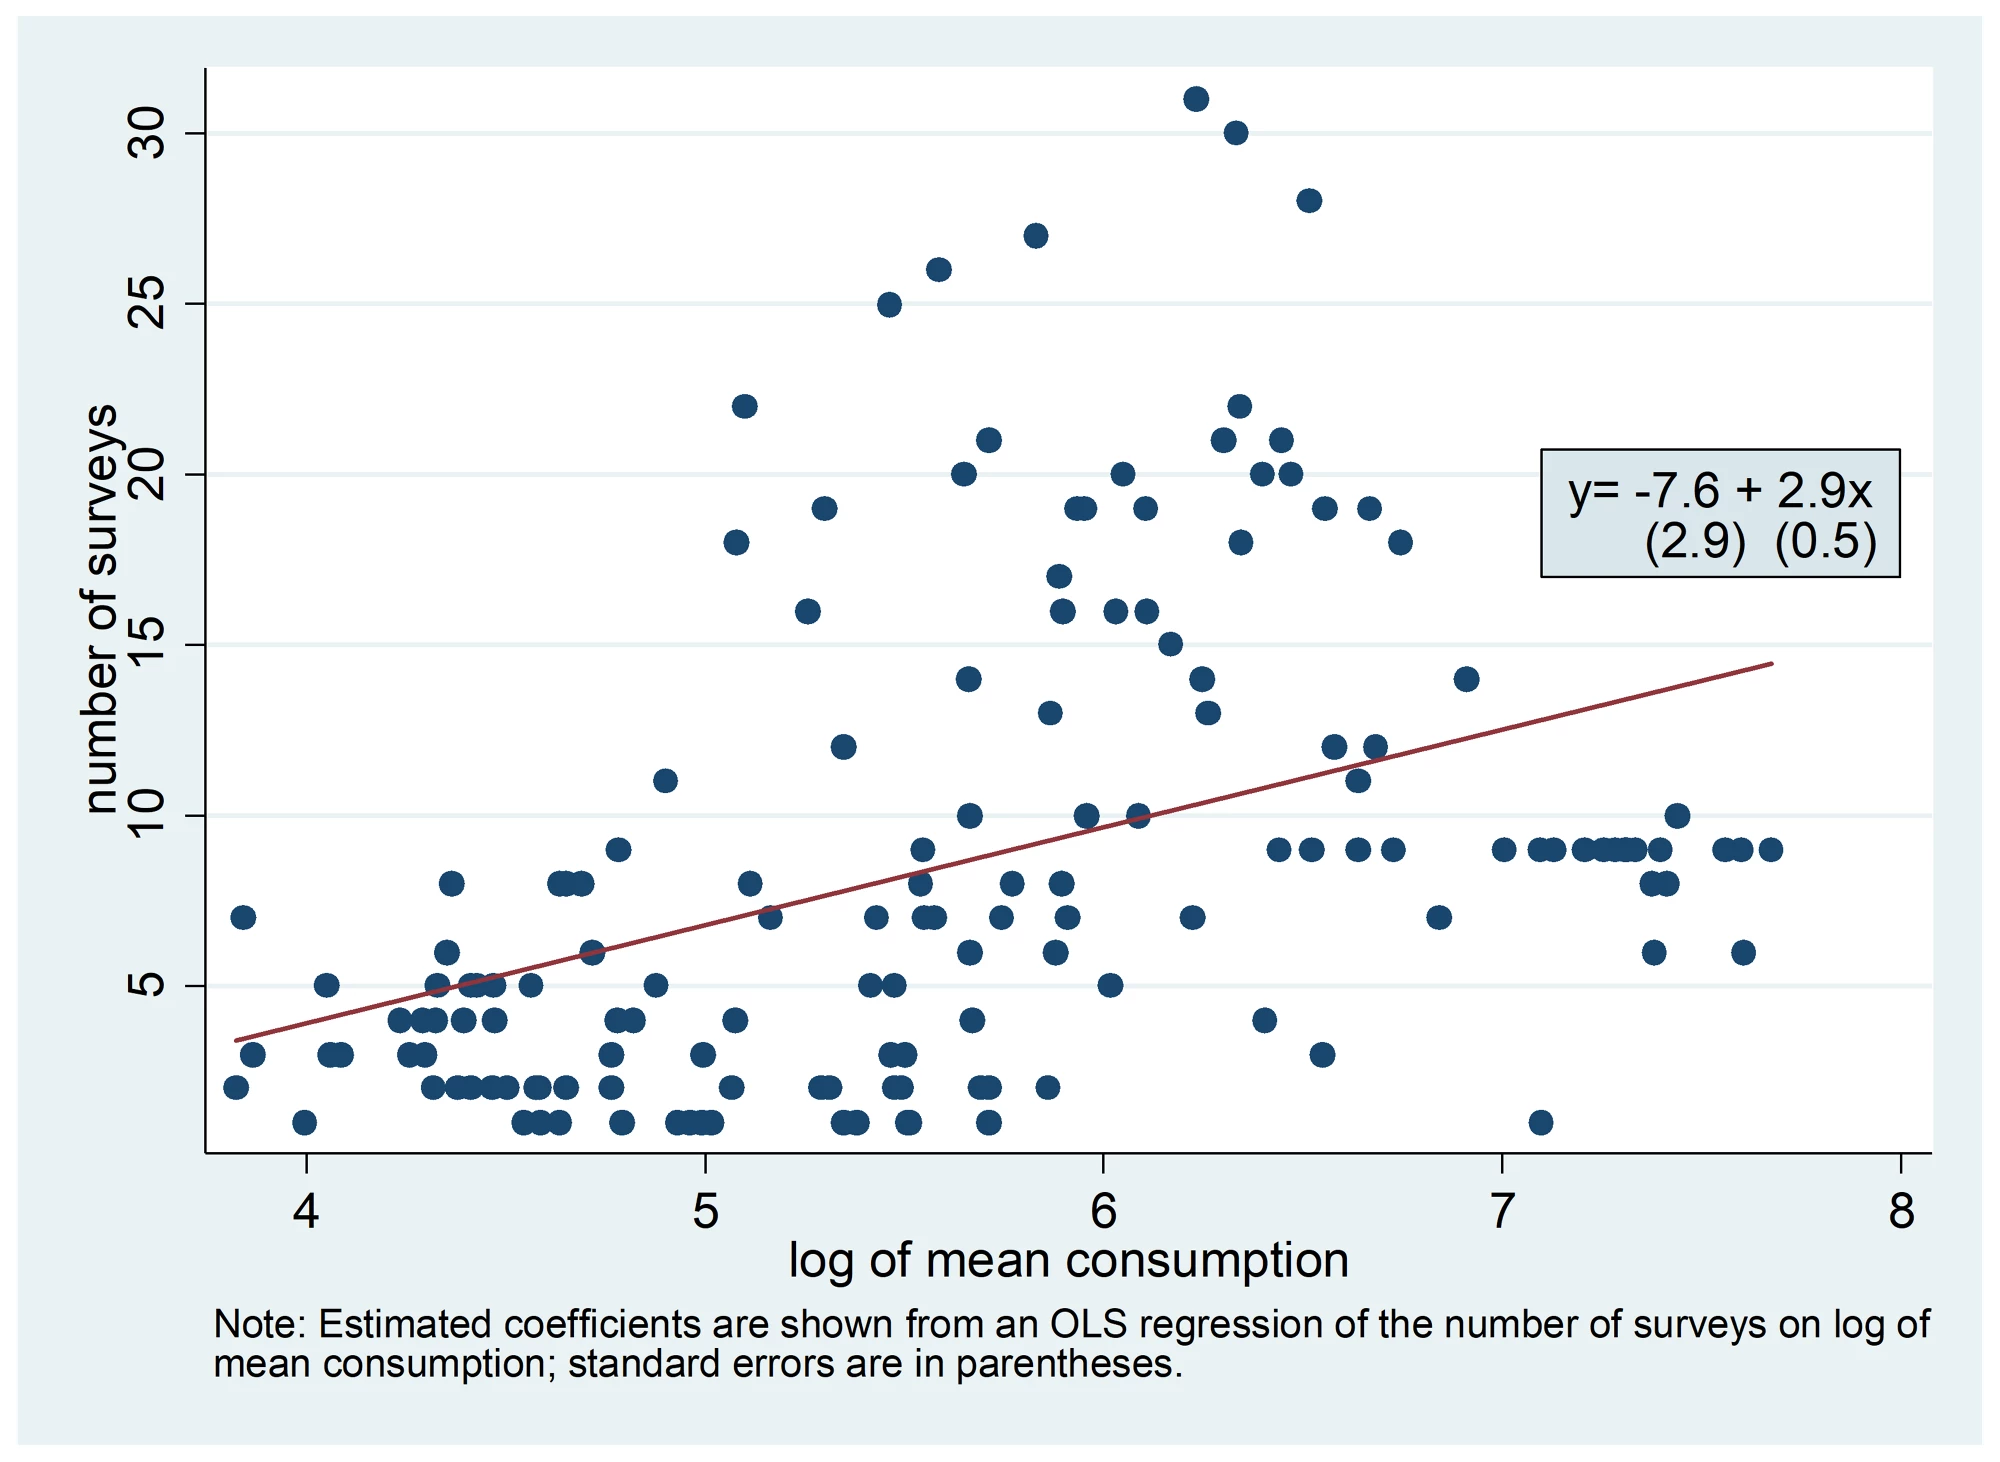
Yet, finding the answers to these questions are challenging tasks, simply because comparable household consumption data for a specific country from multiple time periods are often unavailable, particularly for low-income countries. As an example, using the World Bank’s PovCalNet database, we plot in Figure 1 the number of data points of poverty estimates for a country against its consumption level. For better presentation, we also graph the fitted line for the regression of the former outcome on the latter outcome.
The estimated slope of this regression line is positive and strongly statistically significant, suggesting that a 10 percent increase in a country’s household consumption is associated with almost one-third (i.e., 0.3) more surveys. Figure 1 thus helps highlight the—perhaps paradoxical—fact that poorer countries with a stronger need for poverty reduction also face a more demanding challenge of poverty measurement given their smaller numbers of surveys. This is unsurprisingly consistent with a prevailing perception among some development practitioners that collecting survey data may not be the top priority for many developing countries.
Figure 1: Number of Household Surveys vs. Countries’ Income Level, 1981- 2014

The lack of survey comparability may be ameliorated if (better) data can be produced more frequently, and the Bank’s LSMS-ISA program is an effort in this direction. However, collecting data is an undertaking that can take time and resources. Until that time when all countries have multiple, comparable survey data, what alternatives do we have to obtain poverty estimates when household consumption data are not available? Or worse, if such data are available but are not comparable over time?
In a recent paper, we offer a review of poverty imputation methods that address contexts ranging from completely missing and partially missing consumption data in cross sectional household surveys, to missing panel household data. Notably, a variety of different techniques have been developed to tackle these questions, but unfortunately, they are presented in different forms and lack unified terminology. We aim to discuss these various existing methods under a common framework, with pedagogical discussion on their intuition. Empirical illustrations are provided using several rounds of household survey data from Vietnam. Furthermore, we also offer a practical guide with detailed instructions on computer programs that can be used to implement the reviewed techniques.
We return to more technical discussion in the next post. (In the meantime, if you are interested in this topic, some of our earlier related posts on poverty imputation and synthetic panels can be found here and here).


Join the Conversation