The International Comparison Program (ICP) team in the World Bank Development Data Group commissioned a pilot data collection study utilizing modern information and communication technologies in 15 countries―Argentina, Bangladesh, Brazil, Cambodia, Colombia, Ghana, Indonesia, Kenya, Malawi, Nigeria, Peru, Philippines, South Africa, Venezuela and Vietnam―from December 2015 to August 2016.
The main aim of the pilot was to study the feasibility of a crowdsourced price data collection approach for a variety of spatial and temporal price studies and other applications. The anticipated benefits of the approach were the openness, accessibility, level of granularity, and timeliness of the collected data and related metadata; traits rarely true for datasets typically available to policymakers and researchers.
The data was collected through a privately-operated network of paid on-the-ground contributors that had access to a smartphone and a data collection application designed for the pilot. Price collection tasks and related guidance were pushed through the application to specific geographical locations. The contributors carried out the requested collection tasks and submitted price data and related metadata using the application. The contributors were subsequently compensated based on the task location and degree of difficulty.
The collected price data covers 162 tightly specified items for a variety of household goods and services, including food and non-alcoholic beverages; alcoholic beverages and tobacco; clothing and footwear; housing, water, electricity, gas and other fuels; furnishings, household equipment and routine household maintenance; health; transport; communication; recreation and culture; education; restaurants and hotels; and miscellaneous goods and services. The use of common item specifications aimed at ensuring the quality, as well as intra- and inter-country comparability, of the collected data.
In total, as many as 1,262,458 price observations―ranging from 196,188 observations for Brazil to 14,102 observations for Cambodia―were collected during the pilot. The figure below shows the cumulative number of collected price observations and outlets covered per each pilot country and month (mouse over the dashboard for additional details).
Figure 1: Cumulative number of price observations collected during the pilot

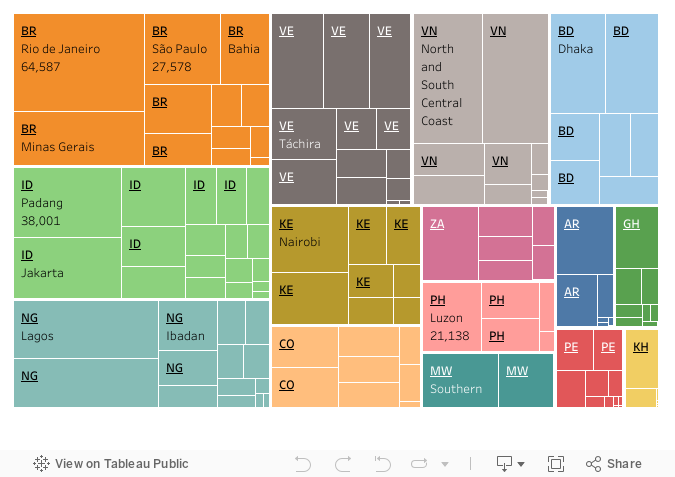
The granularity of the collected data allows for intra-country, or sub-national, analysis. The figure below presents the availability of price observations at state or municipality level for each pilot country (mouse over the dashboard for additional details).
Figure 2: Total number of price observations collected during the pilot
The price data collected through the pilot are accompanied by a rich set of metadata―including Global Positioning System (GPS) coordinates and related geographical designations, time-stamps, volume and weight details, and brand and model information―allowing for detailed localized and temporal analysis.
The example below shows the collected individual price observations for Rio de Janeiro, Brazil, mapped based on the longitude and latitude coordinates of each collected observation.
Figure 3: Locations of collected price observations in Rio de Janeiro, Brazil
Potential applications of the collected data include spatial inter-country and sub-national price studies, as well as temporal price analysis, such as the ones shown below.
The first map below shows the price levels for the “food and non-alcoholic beverages” category, estimated based on the data collected for the five pilot countries in Africa.
Figure 4: Price level indices (PLIs), number of priced items and number of price observations for the pilot countries in Africa

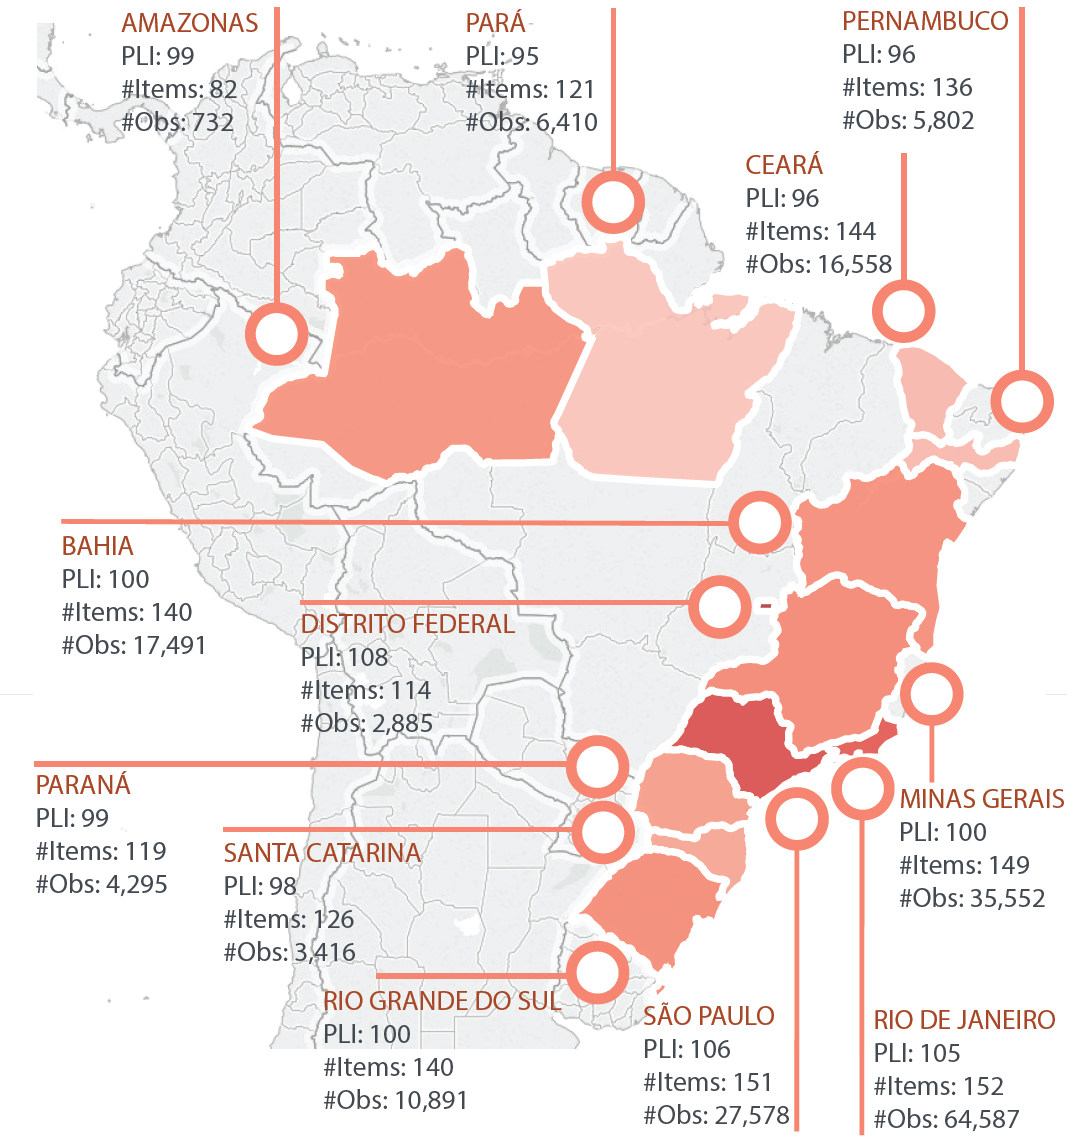
The second map below shows the price levels for the “household consumption” category, estimated based on the data collected for the twelve pilot states within Brazil.
Figure 5: Price level indices (PLIs), number of priced items and number of price observations for the pilot states in Brazil
Lastly, the figure below shows the monthly average prices, number of collected price observations and coefficients of variation (CV) for selected items in Brazil.
Figure 6: Monthly average prices (Brazilian Real), number of observations and CVs for selected items in Brazil

A few key findings and lessons learned from the pilot follow below.
The currently available technologies allow for leveraging on a crowdsourced data collection approach. Certain aspects, such as the accuracy of the GPS coordinates, tend to vary based on the mobile phone used; however, these technological challenges are not a major issue. In addition, building a network of contributors is possible in most countries. The cost of owning and operating a smartphone has dropped significantly, extending the potential contributor base further and, hence, reducing possible contributor-group bias.
The achieved survey coverage tends to vary from a country or region to another; typically, countries or regions with a better network coverage (either wireless or broadband) and denser contributor networks tend to provide better results. In addition, ease of making micropayments to contributors plays a key role in achieving a wider coverage. The legality of conducting this approach in some countries can also pose challenges, as national officials can perceive alternative data sources as a risk.
The quality of the collected data depends highly on the user-friendliness of the data collection application and clarity of the item definitions. Albeit fraud is obviously possible, monitoring contributor behavior and analyzing accompanying metadata makes fraud detection and flagging relatively easy. Optimizing the collection approach and application to avoid fraudulent data points and oversaturated sample sizes for a given item or geographical area are crucial.
The sustainability of the approach depends mainly on the user base and efficiency of collecting data. If data needs and funding resources are pooled together, the price per data point and per user would lower significantly. Furthermore, the private firm operating the network of contributors has to be dedicated and reliable for sustaining such task in the medium to long term.
On the positive side, crowdsourced datasets can be made fully open and accessible to all users in a timely manner. All collected granular data with GPS coordinates and metadata have been released via the Development Data Hub, available here.
Let us know your thoughts and queries on the approach and use-scenarios of the collected data via the comment section below or by sending an email at icp@worldbank.org. We are thrilled to hear your views!


Join the Conversation