One of our goals in the next year is to make World Bank open data easier to find and use. As a start, we recently redesigned the country pages on data.worldbank.org to showcase other open data resources, such as Projects, Finances, Mapping For Results, Microdata, and the Climate Change Knowledge Portal. From any country page, you can now preview the data and navigate to the corresponding country page on any of these other sites.
If you're a developer or data geek and you're interested in how this works under the hood, then read on.
Increasingly, many World Bank data websites include an Application Programming Interface (API) that makes data available in XML, JSON and/or other machine-readable formats. APIs make it easy for any software platform, such as a website, to access and interpret the underlying data.
For the rest of this post we'll use Kenya as an example for how to request open data for a country of interest from a number of World Bank APIs.
World Development Indicators
Most of the country-level, time-series data—including indicators in the WDI section—are accessible through the standard World Bank data API. The website itself is essentially a fancy data browser that queries the API and displays results as tables, charts and graphs.
Take, for example, the per capita CO2 emissions chart that displays data series for Kenya, Sub-Saharan Africa, and the Low Income group:
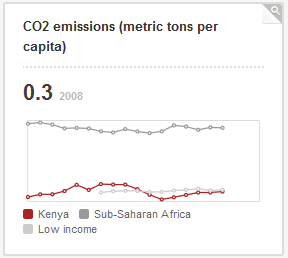
Note that the data website makes it super easy for you to quickly embed interactive graphs of WDI indicators. Just click the magnifying glass in the top right corner of the graph, then click "Embed this indicator in your site," and copy/paste the embed code into any HTML document. For instance:
CO2 emissions (metric tons per capita)
Data from World Bank
However, if you want more control over your presentation, then you may need to access the raw data by calling the API directly. In this example, the country code for Kenya is "KE," and the indicator code for per capita CO2 emissions is EN.ATM.CO2E.PC (all country codes are here; all indicator codes are here). So the API call to generate the Kenya series in this chart looks like this (try pasting this into a browser and see the results for yourself):
http://api.worldbank.org/en/countries/KE/indicators/EN.ATM.CO2E.PC?date=1961:2011&per_page=2000
The "date" parameter specifies the years for which you are requesting data. The large value for the "per_page" parameter just ensures that the API gives you the entire range of possible values. "en" is a language code that specifies English: substitute "es" "fr" or "ar" for Spanish, French or Arabic.
You could also request all three data series at once:
http://api.worldbank.org/en/countries/KE;XF;XM/indicators/EN.ATM.CO2E.PC?date=1961:2011&per_page=2000
We used Flot—a JQuery-based Javascript library—to generate the graphs using the data from the API. Actually, there are several Drupal modules (data.worldbank.org is built on Drupal 6) that we used to build the WDI section; if you're interested, check them out:
- World Bank API to interface with the API and provide performance caching
- Flot to add graphing support
- Views to integrate the API and Flot
- Boxes and Spaces (and some custom code) to put multiple graphs on the same page
Projects & Operations

This section integrates open data from two different World Bank portals: Projects & Operations, which provides data for the two charts, and Mapping For Results, which produces the map.
Projects & Operations
The World Bank Projects API includes a browser that lets you explore different search parameters and view the results of queries. For Kenya, the URL to run the country page looks like this:
http://search.worldbank.org/api/v2/projects?format=xml&fl=id,countryname,boardapprovaldate,totalamt&countrycode_exact=KE&status_exact=Active^Closed&prodline_exact=GU^PE&frmYear=1947&toYear=2012&rows=10000
The Projects API returns a list of projects for the specified search parameters. Unfortunately, the Projects API does not aggregate results by year or category, so the website performs this aggregation itself using the board approval date, and an offset to convert the aggregation from calendar year to fiscal year before generating the charts with Flot:
foreach ($projects->projects as $key => $value) {
 $year  = date("Y", strtotime($value->boardapprovaldate));
 $month = date("n", strtotime($value->boardapprovaldate));

 # use str_replace to remove commas so we can do math
 if($month totalamt);
 else
  $sums[$year+1] += str_replace(',', '', $value->totalamt);
}
Mapping for Results
The Mapping for Results website overlays the location of World Bank projects in a country with basic development indicators such as poverty, infant mortality and population density. The MFR website is fully interactive, but we needed a static map for the country pages, and the nice folks on the MFR team were kind enough to create one for us. The URL for the static map just uses the 2-character ISO code to specify the country, like this:
http://maps.worldbank.org/isocode/ke.png
Finances

This section integrates with the World Bank Finances website. While the Finances section features four select data sets, only some data sets are shown for any particular country, based on the country's status:
- Summary of IBRD Loans
- Summary of IDA Credits
- Summary of Contributions to Financial Intermediary Funds
- Summary of IDA Grants
Any data set on the Finances platform is accessible via an API. To see the API, open the data set, then click the "Export" button at the top, and click "API." For instance: here is the API call to retrieve a summary table of IDA credits by country (the meta parameter can be used to omit metadata, which produces smaller, faster results):
https://finances.worldbank.org/api/views/7izs-nyu8/rows.xml?meta=false
It's fairly straight-forward to search the data set for the Kenya record, and display a simple bar chart (using Flot again), or a table, depending on the data set.
Surveys (Micro-Data)

The World Bank Microdata website has a faceted search engine for searching the library. The Surveys section simply uses the search engine to request a list of recently added surveys for a particular country, and displays the results in a list. For example:
http://microdata.worldbank.org/index.php/api/catalog/search/format/xml/?sort_by=proddate&sort_order=desc&country[]=Kenya
Climate Change
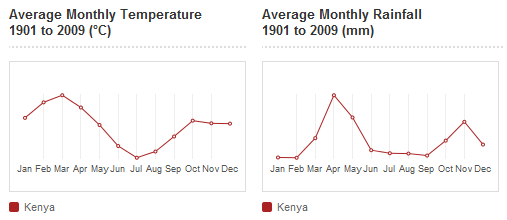
The climate change section utilizes data from the Climate Change Knowledge Portal, which includes an API for accessing climate data. As before, the approach is to request data for the current country and graph the results using Flot. Here are the API requests for historical data on Kenya—temperature and precipitation, respectively:
http://climatedataapi.worldbank.org/climateweb/rest/v1/country/cru/tas/month/KEN.xml
http://climatedataapi.worldbank.org/climateweb/rest/v1/country/cru/pr/month/KEN.xml
Country Codes & Names: Are They All The Same?
All of these examples require that you somehow specify the country of interest, either by name or country code. How do you know what name or code to use for a particular country? In most cases, the correct name or code is listed in the API. These are the assumed values for each of the requests above.
However, we discovered that each section (except the WDI) has at least some subtle exceptions in how countries are specified. For instance, "Egypt, Arab Republic" is abbreviated in some APIs, but spelled out on others. The 2-character code for the Republic of Yemen is "YE" in some interfaces, but "RY" in others.
In a perfect world, countries would be specified the same on every single website, but alas, the real world is not so simple! To accommodate, we developed an "exceptions table" which can be used to identify when country names or codes are different from what they are on the data website (if you're interested, the table is here). Whenever we needed to call an API, we used the value provided by this "exceptions table" if there was one, and used the value provided in http://api.worldbank.org/en/countries if there wasn't. For example:
/*
We need to determine the country name expected by the World
Bank Finances website for a country of interest, in this
example "CD," or the Democratic Republic of Congo. First
check if there is an "exception" for the Finances website */

if( isset($wb_alt_api_parameters['CD']['fapi_alt_name']) )
  $country_name = $wb_alt_api_parameters['CD']['fapi_alt_name'];
else {
/* Otherwise, use the wbapi Drupal module to load the
"default" from the data website's API */
  $wb_country = wbapi_countries_load('CD','en');
  $country_name = $wb_country->name;
}
Hopefully this quick overview will help you leverage World Bank data for your own purposes! Leave a comment or send email to data@worldbank.org if you have any questions.

Join the Conversation