
Last month we reported that remote-sensed nitrogen dioxide (NO2) emissions fell sharply for nine major cities across the world amid lockdowns related to the coronavirus (COVID-19). Remote-sensed emissions data may partly alleviate data constraints in contexts where timely measurement of economic activity is critical at granular spatial and temporal scales. However, interpreting these changes across a diverse country and linking them to meaningful disruptions in economic activity is challenging. Below, we use India to illustrate how data on emissions reductions may be combined with other types of remote-sensed data — all of which are available for every country in the world — to better understand changes in local economic activity and guide policy responses.
India conducted its last census and national household survey in 2011. Since then, the country has experienced a rapid economic and urban transformation, making this survey and census data outdated. To partially overcome this, we developed a spatial typology for the entire country using remote-sensed indicators, averaged across 2019, for 2,337 third-level Indian administrative units (known as subdistricts, tehsils, talukas or mandals) (Table 1). Instead of relying on a simple urban-rural dichotomy (which is challenging to determine in rapidly urbanizing contexts) or one based on agroecology, our typology combines indicators relevant to urbanization, agglomeration of population and economic activity, reliance on agriculture for livelihoods, and geographic features.

The indicators are standardized; values below the average are negative and the magnitudes are on a scale that allows for comparisons. The largest cities (for instance, Delhi, Mumbai, Kolkata, and Chennai) are dense, with low vegetation and large values for night lights and NO2 emissions. The industrial towns (either in areas near mineral deposits or adjacent to the largest cities) have levels of NO2 emissions that are comparable to the large cities, but they are significantly less dense and have lower night-time light radiance. However, the majority of the population does not live in large cities or industrial towns.
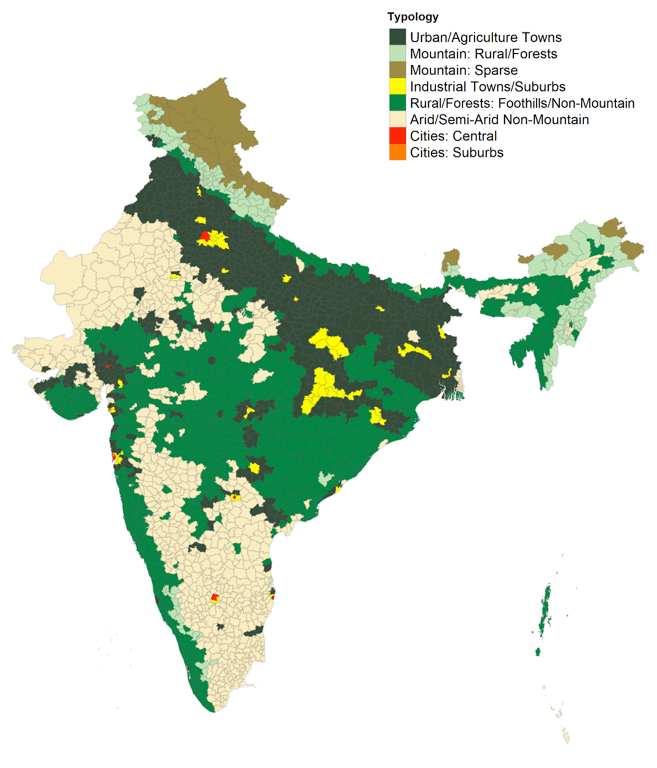
As Figure 1 shows, the other categories are geographically clustered. The Urban/Agriculture towns populate the fertile Indo-Gangetic plain and may be characterized as high-density rural areas. The Non-Urban Non-Mountain areas are less dense, and have more forests, with lower levels of emissions and night-light radiance. These cover the western hills (ghats), Himalayan foothills, and the forest areas across the middle of the country.
Table 1: Clustering of Indian Administrative Level 3 units based on 2019 averages

Figure 1: A typology of Indian Sub-Districts
Employing this typology, we compare percentage changes in NO2 emissions between April 2020 and April 2019 to infer changes in economic activity that were caused by the COVID-19 lockdown. As shown in Table 2, we find that about three-quarters of the country experienced a reduction in emissions of at least 10%. Without exception, the largest cities experienced emission reductions greater than 25%. In contrast, only 4.4% of the population experienced an increase in emissions, chiefly in non-urban and non-industrial areas, suggesting the possible influence of forest fires and/or crop burning. Taken together, Table 2 suggests that while reductions were most pronounced in the largest cities, emission reductions were widespread — consistent with the stringent nationwide lockdown.
Table 2: Changes in NO2 Emissions (averages weighted by population)

We have illustrated how combining different types of remote-sensed data allows for a more nuanced understanding of the variation in emission reductions across a diverse country. The next step in this analytical agenda is to try to combine this understanding with information more closely related to changes in local economic activity and household welfare — such as high-frequency phone surveys, price data, mobility patterns drawn from social media activity, or anonymous transaction records from debit and credit cards. We hope this will create a framework for data analytics that may be applied in other contexts as countries begin to open and address the devastating economic consequences of the lockdowns. Stay tuned.


Join the Conversation