
Our interviewers are still in the field, we need more time to complete the survey, could you extend our server for two more months? We receive such requests every day. Why do so many of our users fail to estimate the timing of their fieldwork?
Survey Solutions is a free platform for data collection developed by the World Bank and used by hundreds of agencies and firms in 143 countries. Many users of the Survey Solutions host data on free cloud servers provided by the World Bank. A user requests a server by filling in a form where he indicates the duration of the planned survey, the number of cases to be collected, and provides other relevant information. We impose no restrictions on how long a user can use the servers. Any survey end date is accepted. Over the last six years we have accumulated data on more than 2,000 surveys. We use information about surveys that collected 50 or more cases for this analysis.
How well can people conducting surveys follow the survey schedule?
Survey duration
Figure 1 shows differences between the survey end dates anticipated by our users and the dates registered in server activity logs. 15% of users finished their surveys on time (within a week of the date they planned the survey would end); about 47% of users underestimated the amount of time they needed for the field work (right tale, positive difference in days), and the rest finished surveys faster than they initially planned (left tale, negative).

The losses for agencies conducting surveys are higher if the survey duration is underestimated or if a survey started later than expected. The contracts with interviewers and other actors involved in the fieldwork need to be extended, the interviewers have to be paid for the extra days; the activities that depend on completion of the survey work are shifted, etc. Agencies that finish surveys earlier could also incur some losses, but these are relatively small.
Are people getting better at estimating field work duration the more surveys they conduct? Figure 2 shows that compared to novice users, a higher proportion of users who already conducted at least one survey finished their fieldwork earlier than they reported on the survey request form. But the proportion of users who underestimated the duration of their fieldwork declined only marginally between these two groups.

A user can extend her server if the fieldwork spans past the original survey end date. Figure 3 presents the distribution of the number of requests for server extension for novice and experienced users. About 43% of our users extended their servers more than once, with about 3% requesting 4 and more server extensions. That means some of these users, after underestimating the timing of the survey, repeat the same mistake again and again.
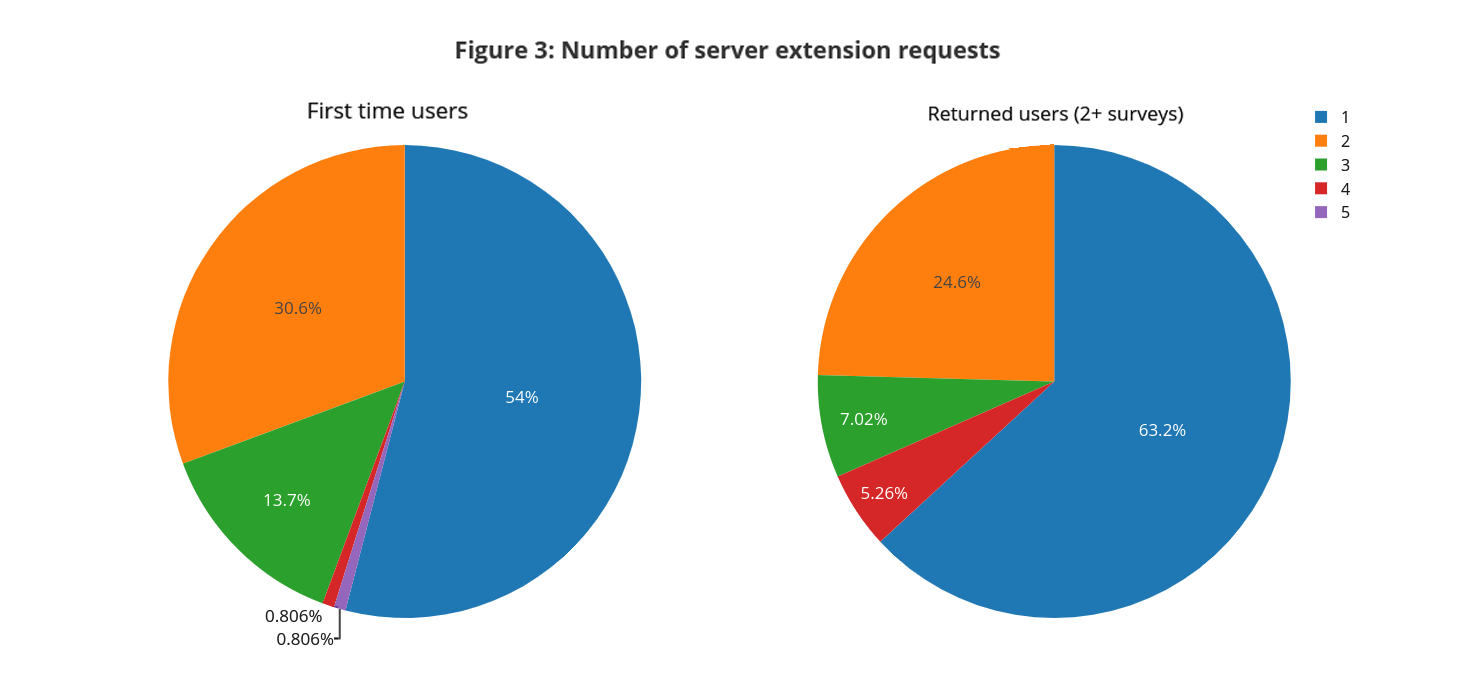
Similar to Figure 2, the assessment of fieldwork duration improves with experience: the share of users who requested only one extension increased from 54% for the new users to 63% for the “experienced” users. However, even among the latter group, about 12% of users revised the end date of their survey three or more times over the course of their fieldwork.
Number of questionnaire revisions during the field work
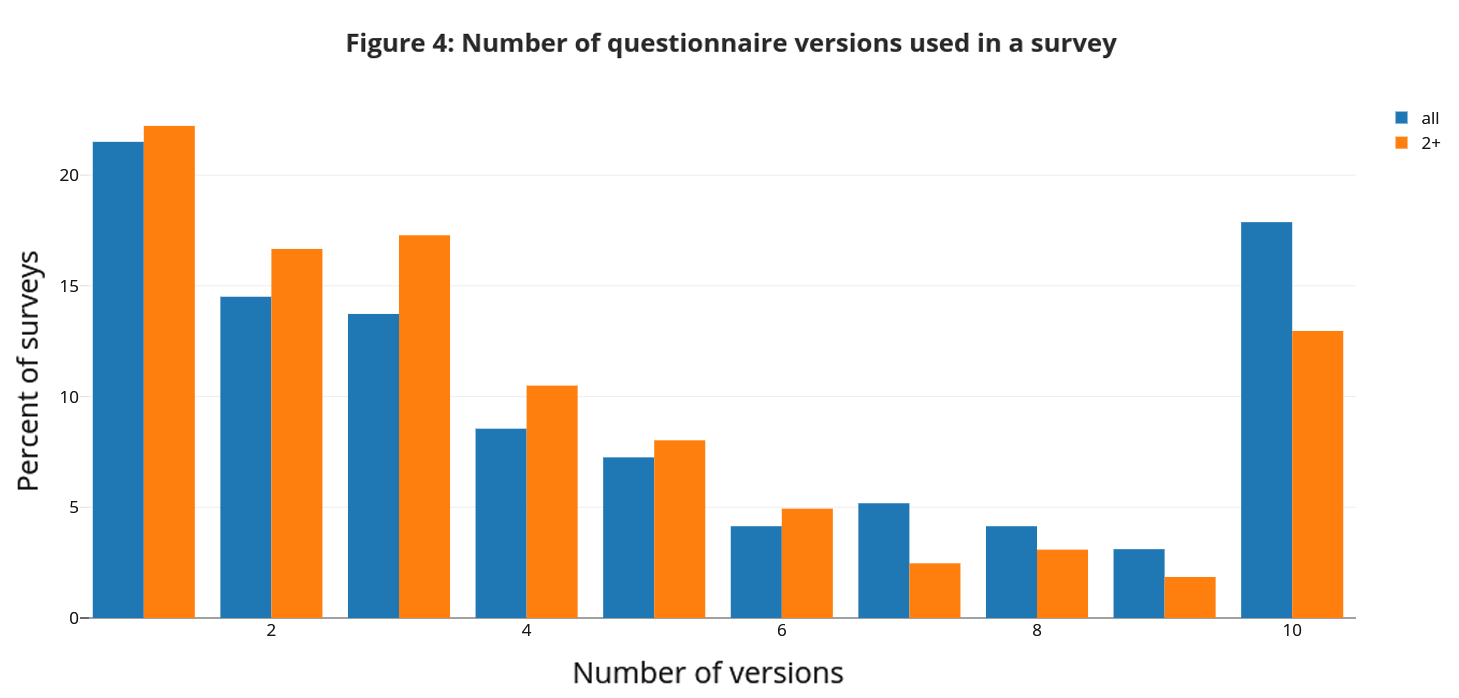
Another dimension of a proper survey planning is the timely preparation and testing of the survey instruments. CAPI or CAWI surveys simplify the process of questionnaire updates and allow addressing issues undetected during the piloting when the survey is already in the field. For example, the analysis of incoming data might show that some questions take respondents too long to answer, indicating that such questions could be badly formulated. If so, an updated version of the questionnaire with better wording for the problematic questions could be deployed. This, however, comes with a cost of potential loss of data comparability. The best practices of survey management recommend a finalization of the questionnaire before the fieldwork and minimizing the number of questionnaire revisions once a survey is in the field. This is especially important for surveys conducted digitally because, compared to paper questionnaires, digital survey instruments usually contain validation conditions and algorithmic skip patterns that should be carefully tested before the field work.
Figure 4 depicts the frequencies of questionnaire revisions during the fieldwork for all surveys in our sample and for users who conducted two or more surveys. About 20% of our users have used a single version of the questionnaire during their fieldwork. Most of the users revise their survey instruments more often. A surprisingly high proportion of novice users made 10 or more revisions of their questionnaires during the fieldwork. The number of questionnaire revisions declines for more experienced users, but the proportion of users revising their instrument 6 or more times while in the field still seems to be high.
Conclusion
We present here a unique (to our knowledge) analysis of metainformation about a large number of surveys conducted in virtually all developing countries. It is difficult to qualify our results because we are missing the baseline to which to compare our statistics. The survey fieldwork depends on many factors that are beyond the control of people conducting surveys. Political unrest, changes in donor funding policies, delays caused by bureaucratic procedures, etc., all could derail the survey schedule. More formally, we have no information about the actual variances of statistics we are presenting. Theoretically, we could calibrate, for example, the ability of our users to predict duration of their fieldwork or the number of times they modify questionnaires, by similar statistics from the best surveys firms or most advanced national statistical offices. Unfortunately, we have no such information. Nevertheless, we do believe our findings highlight important issues that data collection agencies need to think about during the survey planning processes.
Good quality surveys are expensive. An average nationally representative survey in developing countries costs about US$2M (Kilic et al. 2017). A large part of these costs could be incurred as payments to interviewers, transportation costs, and other time-sensitive expenses. Closely adhering to a survey schedule seems to be critical for managing costs of the surveys and ensuring high data quality. Our findings demonstrate that many agencies involved in data collection are not able to plan their fieldwork properly. This could result in overblown budgets, negatively impact of the quality of collected data, and delay the release of data to the public. The survey planning agenda is often neglected in the capacity building efforts. The international development community might need to rethink the survey training curriculum as the returns on improvements in the ability of data collection agencies to plan and follow survey schedules appear to be high.


Join the Conversation