
Bottom line
Combinatorial innovation is driving innovation in satellite-based economic measurements at unprecedented resolution, frequency and scale. Increasing availability of satellite data and rapid advancements in machine learning methods are enabling a better understanding into the fundamental forces shaping economic development.
Why satellite data innovations matter
The desire of human beings to “think spatially” to understand how people and objects are organized in space has not changed much since Eratosthenes—the Greek astronomer best known as the “father of Geography”—first used the term “Geographika” around 250 BC. Centuries later, our understanding of economic geography is being propelled forward by new data and new capabilities to rapidly process, analyze and convert these vast data flows into meaningful and near real-time information.
The increasing availability of satellite data has transformed how we use remote sensing analytics to understand, monitor and achieve the 2030 Sustainable Development Goals. As satellite data becomes ever more accessible and frequent, it is now possible not only to better understand how the Earth is changing, but also to utilize these insights to improve decision making, guide policy, deliver services, and promote better-informed governance. Satellites capture many of the physical, economic and social characteristics of Earth, providing a unique asset for developing countries, where reliable socio-economic and demographic data is often not consistently available. Analysis of satellite data was once relegated to researchers with access to costly data or to “super computers”. Today, the increased availability of “free” satellite data, combined with powerful cloud computing and open source analytical tools have democratized data innovation, enabling local governments and agencies to use satellite data to improve sector diagnostics, development indicators, program monitoring and service delivery.
Drivers of innovation in satellite measurements
- Big (geo)data – Satellites in Global Development are improving every day, creating new opportunities for impact in development. They capture millions of images from Earth in different spatial, spectral and temporal resolutions, generating data in ever increasing volume, variety and velocity.
- Open Source – Open source annotated datasets, the World Bank’s Open Data, and other publicly available resources allow to process and document the data (e.g. Cumulus, label maker) and perform machine learning analysis using common programming languages such as R or Python.
- Crowd – crowdsource platforms like MTurk, Figure-eight and Tomnod are used to collect and enhance inputs (reference data) to train machines to identify automatically specific objects and land cover on Earth.
- High Quality Ground Truth – Robust algorithms that analyze the entire planet require diverse training data, and traditional development Microdata for use in machine learning training, validation and calibration, for example, to map urbanization processes.
- Cloud – cloud computing and data storage capabilities within platforms like AWS, Azure and Google Earth Engine provide scalable solutions for storage, management and parallel processing of large volumes of data.
Satellite measurements in development operations
As petabytes of geo data are being collected, novel methods are developed to convert these data into meaningful information about the nature and pace of change on Earth, for example, the formation of urban landscapes and human settlements, the creation of transportation networks that connect cities or the conversion of natural forests into productive agricultural land. New possibilities emerge for harnessing this data for a better understanding about our changing world.
Take for example urbanization processes. Urbanization has been one of the most fundamental trends of the past two centuries. Between 1950 and 2014, the share of the global population living in urban areas increased from 30% to 54%, and by 2050 it is projected to expand by an additional 2.5 billion urban dwellers. Traditional approaches for measuring economic development, such as census counts and demographic surveys are costly, time-consuming and labor-intensive, and often involve measurement. These constraints mean they are produced infrequently and can offer only limited insight into economic drivers and development. As new sources of satellite data become available, urban and economic research are combining data collected by means of traditional survey-based methods with digital, multispectral images that are almost instantly analyzed to capture those visible characteristics of development, for example, the pace and extent of urbanization, the intensity of light emitted at night or the conversion of vegetation into man-made structures. Earth observation data provides valuable information about the nature, evolution and drivers of economic development as well as insights about what cannot directly be observed in an image – the number of people living in cities, the level of non-agricultural employment or production, the pace of resource consumption, or the presence of traffic congestion.
In recent years, satellite-based measurements have been used to enhance the World Bank’s Systematic Country Diagnostics. The 2018 Former Yugoslav Republic of Macedonia Systematic Country Diagnostic led by Marco Hernandez and Cesar Cancho, was the first to use night light and satellite imagery and machine learning algorithms to develop proxy measurements for economic growth, urbanization, and land use from 2000-2018. The satellite measurements of economic growth were overlaid with enterprise survey data to approximate relationships between economic growth and the number of firms (FYR Macedonia SCD, Pg.55, Box 3.3). The algorithms underlying these measurements are open for easy reuse.

Several World Bank initiatives, including a study of over 50 projects in the World Bank Web of Transport Corridors in South Asia, are using this approach to monitor economic impact of past, current, and future projects.

Credit: the Big Pixel Initiative, UC San Diego
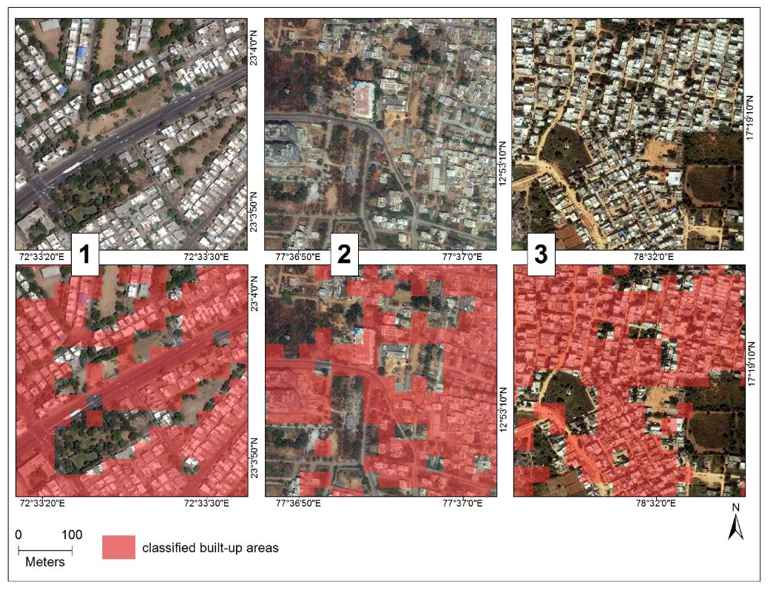
Credit: Goldblatt, R., You, W., Hanson, G. and Khandelwal, A. (2016), Detecting the Boundaries of Urban Areas in India: A Dataset for Pixel-Based Image Classification in Google Earth Engine, Remote Sensing,8, 634.
Summary
As satellite data becomes increasingly accessible and frequent, it is now possible not only to better understand how Earth is changing, but also to utilize these insights to improve decision making, guide policy and promote a better-informed governance.
In recent years, the World Bank Group has been working with partners through open source collaborations to put satellite measurements and tools in action to monitor and achieve the 2030 Global Goals. From predicting crop yields in small-holder farms, to measuring the impacts of transportation projects in South Asia and India, to measuring spatial development, monitoring rural electrification and mapping land cover and land use dynamics. These innovations have been incubated through support by the Innovations in Big Data program and the geospatial operations support team in the Development Economics Vice Presidency of the World Bank. In addition to testing and supporting innovative solutions and pilots the World Bank also acknowledges and values the mainstreaming applicability of satellite Earth Observation across all sectors of sustainable development. To achieve a widespread adoption of this technology and eventually foster knowledge transfer to country clients, the World Bank thereby has a long-standing partnership with the European Space Agency (ESA), currently framed under ESA’s Earth Observation for Sustainable Development (EO4SD) initiative.
Additional Learning Resources
- Geo4Dev – conference features renowned experts using geospatial in development
- Measuring Development – workshop CEGA in partnership with the World Bank features technologies that advance ability to measure development
- SATSUMMIT – satellite data for global development conference
- World Bank Open Data – free and open access to global development data
- Google Earth Engine, Remote Sensing Labs – introductory tutorial to remote sensing analysis
- Open Source Geo – free training on open source GIS
- eo-learn – earth observation training from European Space Agency
- CEOS EO Handbook – presents the main capabilities of satellite Earth observations, their applications, and a systematic overview of CEOS agency EO satellite missions and their instruments


Join the Conversation