When you hear the words “top tourist destination,” do sandy beaches and national parks come to mind? Perhaps places with historical significance like the Egyptian pyramids or the temples of Angkor Wat in Cambodia? When we take a close look at the tourism data, we see that some of the top tourist destinations in the world are in low- and middle-income countries, specifically, in the East Asia and Pacific region.
Figure 1:
According to the latest data in World Development Indicators (WDI), there were more than one billion international arrivals (overnight visitors) worldwide in 2012. Where did these tourists travel to and how have the tourist arrival figures changed from 1995 to 2012?
Top tourist destinations: worldwide comparisons
When we look at the ten low- and middle-income countries with the largest number of overnight visitors, we see that China, Malaysia, and Thailand, all East Asia and Pacific region countries, are among the top visited countries by tourist arrivals and tourist receipts. Europe and Central Asia is the second most popular tourist region (Turkey), followed by Latin America and Caribbean (Mexico), Middle East and North Africa (Egypt), Sub-Saharan Africa (South Africa), and South Asia (India).
China has remained the top tourist destination among low- and middle-income countries since it overtook Mexico in 1996. While Mexico’s tourism numbers have dwindled significantly since, the list of top ten countries across all incomes for tourist arrivals still includes three low- and middle-income countries: China, Turkey, and Malaysia.
Most visited countries by international tourist arrivals (in millions)
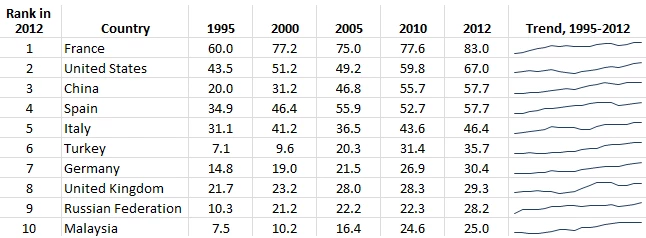
Source: World Development Indicators 2014
How does tourism data differ among low- and middle-income and high-income countries? When we look at the share of the world’s international tourism receipts, low- and middle-income country destinations are closing the gap. In 1995, low- and middle-income countries’ share in international tourism receipts was only 17% of the world’s total, while high-income countries’ share was 83%. By 2012, tourism receipts of low- and middle-income countries more than quadrupled, and is now equivalent to 28% of the world’s total, while high-income countries’ receipts only doubled, bringing them down to 72%.
Figure 2:
Many of the top tourist destinations are among the largest countries in the world, but for which countries does international tourism revenue matter the most? When measuring tourism receipts as a percentage of a country’s exports, it’s no surprise that 9 out of 10 small state countries have tourism receipts that make up more than half of their export revenue in 2012.
Figure 3:
Data limitations
How is tourist arrivals data collected, and what are some limitations when it comes to making accurate cross country comparisons? The World Tourism Organization (a United Nations agency) goes to great lengths to provide us with cross-country comparable tourism data. However, caution should be used when comparing international tourist arrivals across countries. Since the data on inbound tourists refer to the number of arrivals and not to the number of people traveling, a person who makes several trips to a country during a given period will be counted each time as a new arrival. Also, when data on international nonresident tourists at national borders are unavailable or incomplete, the data shows the arrivals of international visitors, which can include tourists, same-day visitors, cruise passengers, and crew members. Lastly, sources and collection methods for arrivals differ across countries. For some countries, the data are collected from border statistics (police, immigration, and the like) and supplemented by border surveys. For other countries, data are from tourism accommodation establishments and may be limited to include only arrivals by air or arrivals staying in hotels.
To find out which type of arrivals data was collected for each country, click on the metadata links in the World Development Indicators (WDI) database or view the WDI online table 6.14. Explore more travel and tourism indicators by accessing the WDI database from the Open Data website.
Indicators and codes used in this post:
- International tourism, expenditures (current US$) ST.INT.XPND.CD
- International tourism, expenditures for passenger transport items (current US$) ST.INT.TRNX.CD
- International tourism, expenditures for travel items (current US$) ST.INT.TVLR.CD
- International tourism, number of arrivals ST.INT.ARVL
- International tourism, number of departures ST.INT.DPRT
- International tourism, receipts (current US$) ST.INT.RCPT.CD
- International tourism, receipts for passenger transport items (current US$) ST.INT.TRNR.CD
- International tourism, receipts for travel items (current US$) ST.INT.TVLR.CD
- International tourism, expenditures (% of total imports) ST.INT.XPND.MP.ZS
- International tourism, receipts (% of total exports) ST.INT.RCPT.XP.ZS

Join the Conversation