
With rising urbanization and motorization leading to congestion and pollution, reliable traffic data can be critical to monitor and manage traffic. Automated traffic data has traditionally come from installing physical sensors on roads; however, sensors can be expensive and data are only captured at the locations of the sensors. How can policymakers or researchers know what is happening across a city or an entire country?
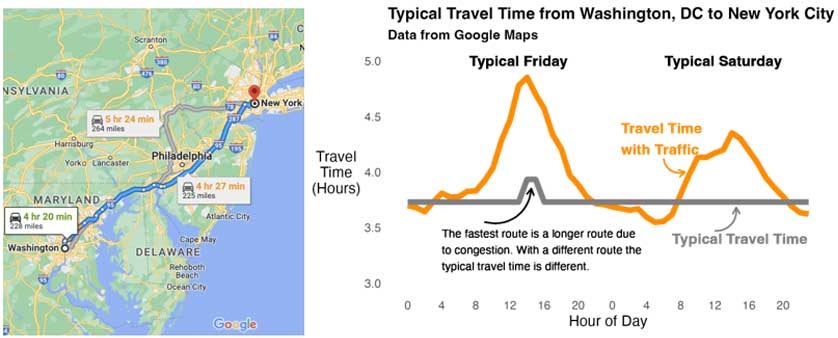
Big private sector data can help to complement or be a substitute for physical sensors. Companies such as Google, Mapbox, Microsoft, Waze, Uber, TomTom, and StreetLight primarily detect vehicle trips from smartphone application GPS pings. Google Maps has been particularly popular due to their coverage and ease of accessing data. Typically, you query travel times between origins and destinations. Google provides both travel time accounting for traffic and typical travel time (see Figure 1). Existing functions in R, Python, and Stata make it easy to input location pairs and retrieve the travel time and distance traveled. Researchers have studied congestion using Google Maps travel time data in Bogota, Boston, Jakarta, Santiago, and Spain.
Figure 1. Travel time from Google Maps (left) can be queried at regular intervals to observe trends in travel time and congestion (right)
Yet accessing sufficient Google Maps travel time data can be cumbersome and costly for policymakers. Each query only tracks travel time for one origin-destination trip. To track traffic across an entire city, users need to make thousands of queries. And even though the first queries are free, additional queries would build up charges.
An alternative is Google Maps traffic information, which displays a map with roads colored according to one of four traffic levels. With this tool, users can observe traffic levels across all roads in a city with just a couple queries. While this has been used in New York City and Dar es Salaam, a key challenge is that the data can be difficult to work with. The Google Traffic API returns an interactive map with traffic information displayed, so turning the map into machine-readable data requires georeferencing the map and converting the traffic colors into data. To make Google traffic data more accessible to policymakers, we needed a tool to make the data available and usable for policy planning and interventions.
Introducing googletraffic R package
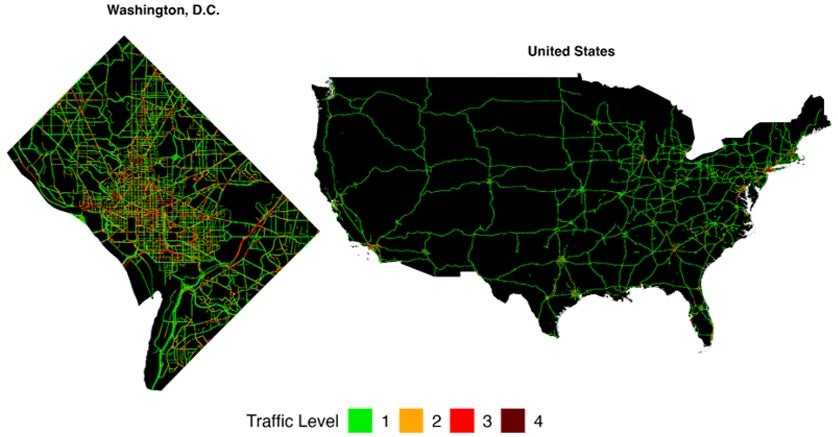
The ieConnect team in the Development Impact Evaluation (DIME) department developed the googletraffic R package to facilitate using Google traffic information as a data source. The package allows a user to simply enter their area of interest (e.g., a shapefile of a city), and the package outputs georeferenced traffic data, where the dataset can have one of four values indicating the level of congestion (1 = no congestion, indicated as green in Google, to 4 = heavy congestion, indicated as dark red in Google). The georeferenced data can then be combined with other spatially referenced datasets; for example, combining the traffic data with street-level data from OpenStreetMaps can show which roads experience the highest levels of congestion. The package enables querying granular traffic data for small areas such as cities, as well as information across large areas—such as an entire country (see Figure 2).
Figure 2. Google traffic data for Washington, D.C., and the contiguous United States
The googletraffic package is an additional tool for monitoring congestion. Depending on the context, querying travel time data may be more appropriate, or obtaining vehicle count data from physical sensors may be required. Moreover, while researchers have validated Google data against ground-truth data, data from Google are not perfect (smartphone-based data can be biased); consequently, continued validation against physical sensor data is important. However, Google traffic data can provide valuable and easy-to-access information for many contexts.
Case Study: Using googletraffic in Nairobi, Kenya
So how can googletraffic be used for policy? ieConnect’s Smart and Safe Kenya Transport (smarTTrans) project has used the googletraffic package to query data for Nairobi, Kenya. smarTTrans is a collaboration between the Kenyan government and the World Bank to improve the country’s road safety and transport policies, and Google traffic data will be used to understand changes in congestion. Figure 3 shows congestion for a particular day (Friday, July 29) near Nairobi’s Central Business District. The data can help identify areas of high congestion where infrastructure or policy changes may be needed.
Figure 3: Congestion during example day near Nairobi’s Central Business District
We use Kenya’s recent elections to demonstrate how Google traffic data can help detect changes in traffic. A “mass exodus” from Nairobi to the countryside was reported around the time of the election and many shops in Nairobi’s Central Business District closed due to fear of violence. The traffic data confirms these reports with a large reduction in traffic in the days after the election (Figure 4) especially concentrated in the center of Nairobi (Figure 5). Traffic eased back once the winner was announced and once again when the Supreme Court confirmed the results.
Figure 4: Trends in daily traffic around Kenya election

Figure 5: Reduction in traffic from before and after election

The case study documents how Google traffic data can be used to determine the impact of events on congestion. With the massive volume of data Google processes and the wide availability of traffic information, this case study is one of many possible applications of Google traffic data. The data provides a low-cost way to track the effect of policies and interventions on congestion in near-real time. By converting traffic information into an easy-to-use format, the googletraffic package aims to democratize the use of Google traffic data for researchers and policymakers alike. See for yourself by downloading and trying out the package, then share in the comments how you apply the data in your work.
The project benefited from financial contributions from the United Kingdom Foreign, Commonwealth & Development Office (FCDO), the European Union (EU), the World Bank’s Umbrella Facility for Impact Evaluation (i2i) and the World Bank’s Knowledge for Change Program (KCP).


Join the Conversation