The World Bank Group’s Doing Business project collects objective data on 11 areas of business regulations and their enforcement across the largest business cities of 190 economies.
To provide wide-ranging access, we make the World Bank Group’s Doing Business data available through various channels. Apart from the Doing Business website, the full dataset is available via:
- DataBank, a query tool which allows users to select indicators, economies and time periods
- Data Catalog, a one-stop shop for all of World Bank’s development data
- For more experienced users, indicators API make it easy to access the data programmatically (an API allows users to download data without interacting with a user interface);
In an effort to further improve the usability of the data, the Data Group, in close collaboration with the Doing Business team, has recently updated the Doing Business DataBank platform to offer users a set of enhanced analytical tools. We highlight a few of these tools and features and hope you will find them useful for your research:
-
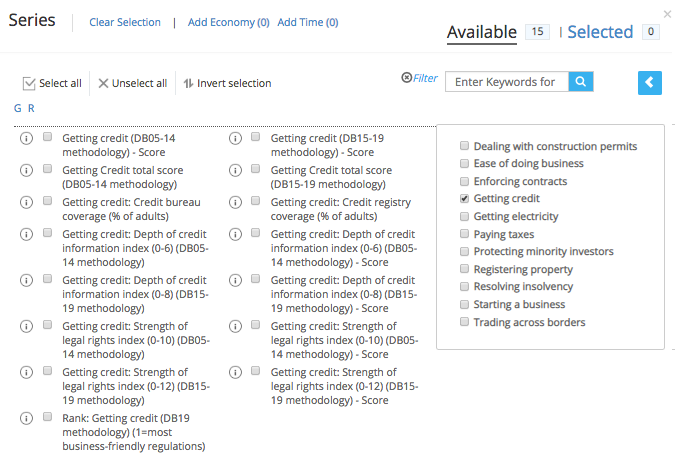
Simplified user interface and indicator search
The Doing Business data are organized according to 11 areas of business regulation, including “Starting a business”, “Registering Property” or “Getting electricity”, among other. Each of these topics has several components. For example, “Getting electricity” is composed of four sub indicators including the number, cost and time of each regulatory procedure required to connect to an electricity grid as well as the reliability of supply and transparency of tariff. The DataBank interface allows users to search for indicators within each topic in a simple and coherent way. All indicators within a topic are collapsed into a single category, and users can browse all topics in a side bar.
-
Intuitive indicator names and codes
The Doing Business project aims to provide consistent time series data. However, the team occasionally revises its methodology to incorporate best practices of measuring the performance and reforms of client countries. To reflect such changes in the data, we update indicator names and codes to easily recognize the applied methodology. For example, the composite indicator for dealing with construction permits was previously called “Dealing with construction permits - Score”. To reflect the change in methodology, the indicator which follows a methodology used between 2006 and 2015 is now called “Dealing with construction permits (DB06-15 methodology) – Score” and the current indicator which uses the methodology first established in 2016 is called “Dealing with construction permits (DB16-19 methodology) – Score”.

If there is a change in methodology for an indicator, a new indicator will be introduced, with the new methodology clearly identified in the indicator name. Data for previous years are maintained in the old indicator. This approach will help users to easily identify the methodology used, and view data over time. As you can see in the figure below, the “Dealing with construction permits – Score” indicator is split according to methodology, and therefore the database only allows for methodologically consistent data to be compared over time.

-
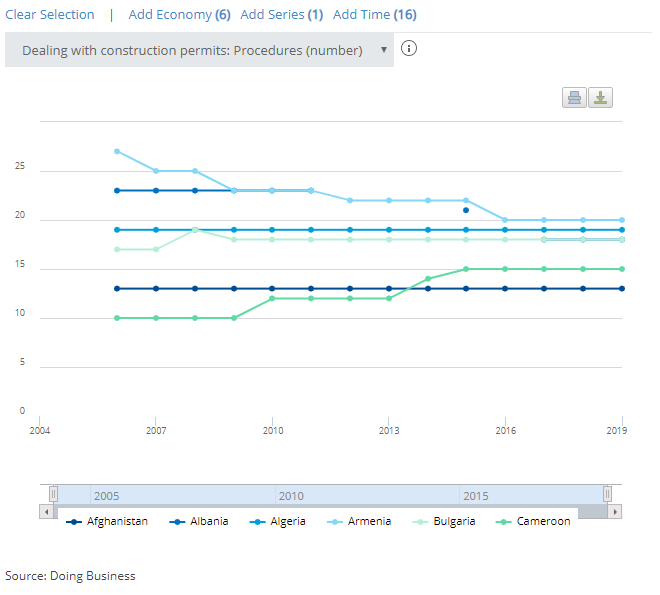
Visualize trends over time and/or across countries
World Bank’s DataBank, a data exploration tool, allows users to view indicators in the form of a table, a line chart, and a map. Users can explore multiple indicators across countries and over time with the help of these visual tools.
-
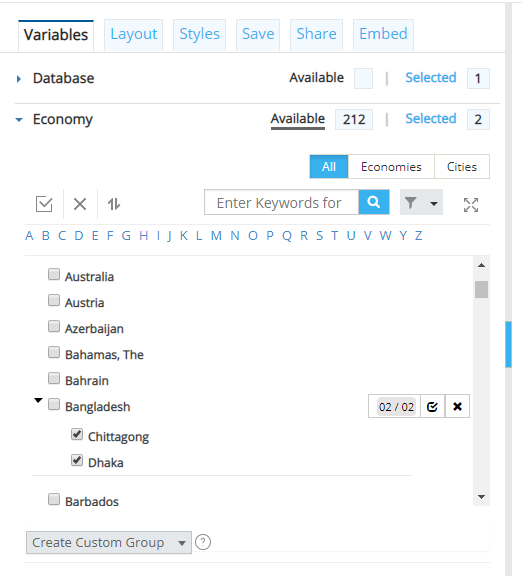
Cities selection
For most economies, the Doing Business team collects data in the largest business city. For 11 large economies (with a population of more than 100 million as of 2013), the team also collects data in the second largest city. In these economies, the final score is computed as the population-weighted average of the scores for these two cities. Data for both cities has been made available in the Doing Business database of DataBank. Users can select city-level data from either the country selection or choose the “Cities” tab to select only city level data.
-
Reproducible code for Doing Business scores
To support our commitment to transparency and reproducibility, the Doing Business website and the Data Catalog now provide a Stata do-file that allows users to replicate the Doing Business scores using the sub-component data.
For feedback and questions, please write to us at: data@worldbank.org


Join the Conversation