"How can I unpivot or transpose my tabular data so that there's only one record per row?"
I see this question a lot and I thought it was worth a quick Friday blog post.
Data often aren’t quite in the format that you want. We usually provide CSV / XLS access to our data in “pivoted” or “normalized” form so they look like this:
But for a lot analyses and applications, particularly data visualisation tools like D3, ggplot2, Tableau, it’s more convenient to have your data “unpivoted” or “denormalized” so it looks like this:
Although this is less space efficient, space is cheap, and it means there’s always only one record per row, so you can use simple functions to access and filter data.
Here are three ways to “unpivot” or “denormalize” your data - in effect, to transpose columns to rows and have one complete record per row.
Unpivoting Data With Excel (Windows only)
Several colleagues use the free Tableau Excel add-in for reshaping data. Tableau also provide a good tutorial for “preparing Excel files for analysis”
This approach is fine if you have Windows and Excel and are working on one file at a time, but many of us don’t use these tools and want tools that fit our own workflows better.
Unpivoting Data With Open Refine;
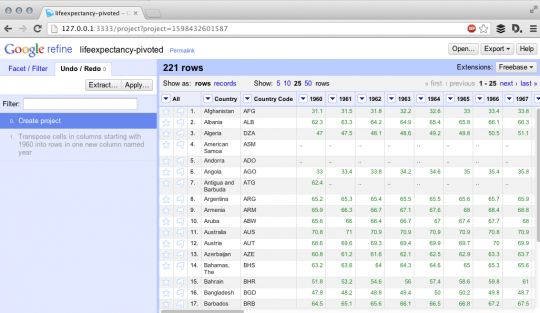
Formerly Google Refine, Open Refine is an awesome cross-platform open-source tool for “data wrangling” - that’s cleaning, reshaping and intelligently batch editing data. Once you’ve got it running, load your CSV. In this case I’m using a CSV for “Life Expectancy at Birth”. You should see something like this:

Now you need to click on the first column you want (in this case “1960”) click “Transpose” -> “Transpose cells across columns into rows”. You should see something like the below:

Make sure the “From” and “To” selections cover the range you want (I’m looking for 1960 -> 2011 or the last column) chooses “one column” named “year” to transpose into, select “prepend the original column’s name into each cell” a select “fill down into other columns. Hit Transpose and you’ll see that your data look like this:
 |
 |
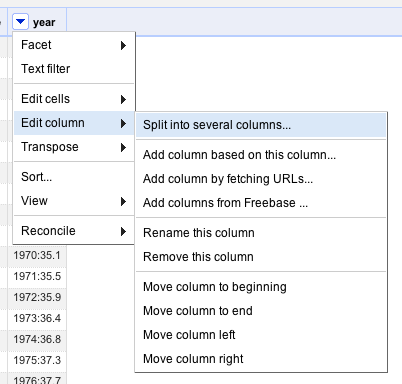
Nearly there - just click on year -> edit column -> split into several columns. Change the separator to “:”, hit OK, rename the resulting column “life_expectancy” and your data will now be in the right form:

You can now export this back out as a csv and you’re done.
Unpivoting Data With Python and pandas
There are a few ways of achieving the desired result in Python but my current favorite is to use the “melt” function (in pandas 0.12) from the reshape module in Pandas. This is very similar to melt in the R reshape library.You can check out this iPython Notebook I created to see it in action step by step, but this is the basic code that will do the trick:
And that’s it - You’ve now got a handful of ways to reshape data like the time series from the World Development Indicators into a format more suitable for analysis.


Join the Conversation