Following our blog on how to use the Poverty and Inequality Platform (PIP)’s Statistics Online (SOL) tool, in this blog, we present a practical example of using SOL and Jupyter notebook within the platform to perform simple poverty and inequality analysis for an example country. We do so directly on the harmonized microdata used for official World Bank poverty and inequality estimates.
Users should bear in mind that not all the microdata reported in PIP is available in SOL for data confidentiality reasons. Access is provided to the surveys that have been made publicly available by each country. In addition to the official World Bank welfare aggregates (along with the necessary price deflation variables), individual and household variables are also included, such as age, gender, education, and access to infrastructure services, which expand the research opportunities for SOL users.
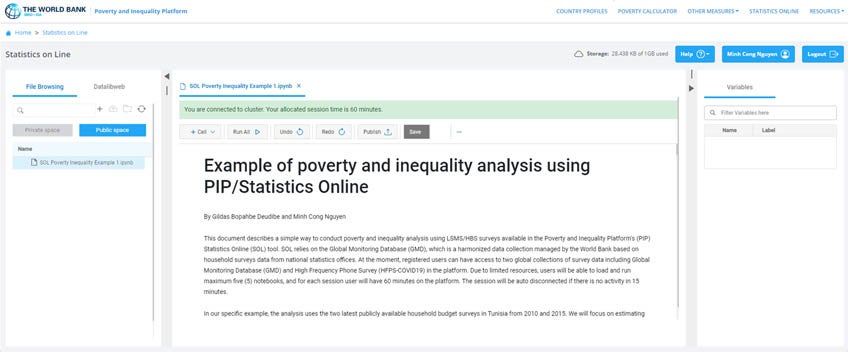
Using Jupyter Notebook with survey data within SOL, one performs calculations using Stata, make graphs, and provide analysis of the results. For this example, we prepared a Notebook, which users can find under the “Public space” tab in SOL. The Notebook is divided into five sections, and each section is structured with explanations, code, and analysis of results. The five sections are basic poverty measures (Foster, Green and Thorbecke (FGT)); analysis of welfare distributions; inequality analysis; poverty rates, and changes across space and time; and additional analysis using individual and household characteristics.
The Notebook describes how simple analysis with executable codes, mathematical formulas, graphs, results, and narratives can be done using SOL. We strongly encourage users to use SOL for their own analysis, create training material, or share knowledge. One of the advantages of SOL is that there is no setup or configuration, and one can share the Notebook with others for reproducibility or collaboration. Notebooks with executed/saved results and graphs can also be exported to documents such as PDF for sharing or dissemination. You can see an example of the exported document in PDF of the Notebook we present above.


Join the Conversation