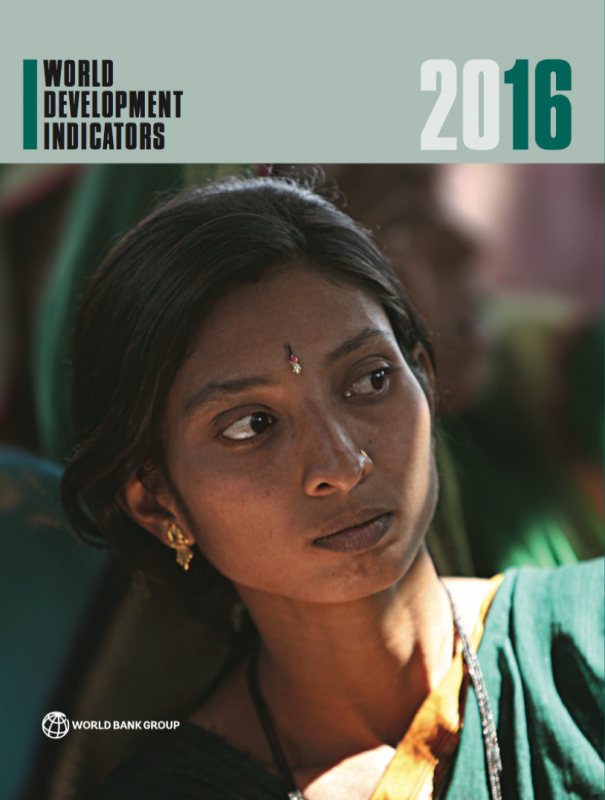
 The 2016 edition of World Development Indicators (WDI) has just been released. The WDI 2016 provides high-quality cross-country comparable statistics about development and people’s lives around the globe. With over 1,400 indicators with data from the 1960s until today, the WDI 2016 is the result of a collaborative partnership of over 50 international agencies, the statistical offices of more than 200 economies, and many more.
Tools to freely access, explore, and interact with the WDI 2016 are available at http://data.worldbank.org/wdi and include:
- Full text of the WDI as a PDF file (7 Mb), which is also accessible from the Open Knowledge Repository (OKR).
- The World Bank’s main data website, http://data.worldbank.org, in five languages: English, French, Spanish, Arabic, and Chinese. The data are also available in a new “beta” mobile-optimized website: http://beta.data.worldbank.org/
- The DataBank query tool which allows users to create, save, and share tables, charts and maps, and embed them on webpages: http://databank.worldbank.org
- Statistical tables and metadata presented by WDI section: http://wdi.worldbank.org/tables
- The DataFinder mobile apps for iOS and Android devices: http://data.worldbank.org/apps
- The Data Helpdesk which responds to frequently asked questions about World Bank data and lets users submit new questions: https://datahelpdesk.worldbank.org/
"For an economic policymaker, it is difficult to think of a more valuable 180 pages than the World Development Indicators 2016. Our annual World Development Indicators is among the most downloaded economics data sets in the world,” said Kaushik Basu, Chief Economist and Senior Vice President. “To know how your country is faring vis-à-vis other countries, in terms of growth, tax-GDP ratio, infant mortality and more than 1,400 other economic and social indicators, this is the definitive publication. Further, this year’s report comes with an interactive dashboard on the SDGs.”
And according to Haishan Fu, Director of the Development Data Group, “By investing in the open data, tools, and team that make the WDI relevant, reliable and accessible for as many people as possible, I’m proud that it continues to be the World Bank’s most widely used dataset.”
Some of the new elements in the WDI 2016 include:
- New highlights booklet featuring the Sustainable Development Goals (SDGs) (PDF: 6Mb) and the interactive SDG dashboards. For each of the 17 SDGs, experts from the World Bank’s Development Data Group, Global Practices, and Cross-Cutting Solution Areas have selected indicators to identify and analyze important trends and challenges, and to elicit discussion on measurement issues.
- The estimates of global and national extreme poverty rates have been updated to the international poverty line of $1.90 a day per person featuring 2011 purchasing power parity (PPP) terms, which is in line with estimates first published last year. Estimates of indicators of shared prosperity for 94 countries, including the growth rates of the average income of the bottom 40%, are also included.
- New indicators to help measure the 169 targets of the 17 SDGs which build on the 8 goals and 18 targets of the Millennium Development Goals but are far wider in scope and far more ambitious. For each SDG, the World View section presents recent trends and baselines against key targets, drawing on the specialist knowledge of staff in the World Bank’s Global Practices and Cross-Cutting Solution Areas.
- Updated and expanded data coverage including: 2014 PPP conversion factors for comparing the real size of economies, which show the world’s three largest economies in 2014 by GDP in PPP terms were: China, United States and India; New indicators covering contraception and family planning, child marriage, violence against women, female genital mutilation, women’s agency, financial inclusion, open defecation, education at all stages of life, and many others.
- Highlights the challenges of SDG measurement. Only a few of the broader set of targets in the Sustainable Development Goals can currently be tracked and measured completely. Both governments and development partners will need to continue investing in national statistical systems and other public institutions, where much of the data will continue to originate. At the same time, the statistical community needs to strengthen partnerships with the private sector and other emerging actors for advancing new techniques of data collection, analysis, and use.
- Updated aggregates so there is no longer a distinction between developing countries (defined in previous editions as low- and middle-income countries) and developed countries (previously high-income countries). Regional groupings (such as “East Asia”) are now based on geographical coverage rather than a sub-set of countries that were previously referred to as developing. In some occasional cases, where data availability or context have dictated it, we’ve excluded high income from some charts or tables, and we’ve indicated that in the footnotes. Previous groupings are still maintained and are available in the WDI database at databank.worldbank.org/wdi
Follow the latest news and stories from the WDI on The World Bank Data Blog athttp://blogs.worldbank.org/opendata and on Twitter: http://twitter.com/worldbankdata
For any questions or comments, please send an e-mail to data@worldbank.org


Join the Conversation