If you've ever visited the World Bank's main data website (data.worldbank.org) you've probably used data from World Development Indicators (WDI). It’s a curated collection of comparable, relevant, international development data and statistics, constructed from some of the best sources around the world. And it’s part of the backbone of the Bank's Open Data Initiative - with over 900 indicators for 200 economies, many of them going back to 1960. It’s available as a book for free download or for sale, as a database, in mobile apps, through an API for software developers, and - if you’re so inclined - as a big old bulk download file.
But let’s get to the point: this year we’ve reviewed our dissemination strategy for the WDI, and decided to make some improvements. Our aim is to find the best way to put data on development into the hands of policy makers, specialists, students, and the public everywhere. We release the WDI around mid-April, and here are the main changes we’re planning:
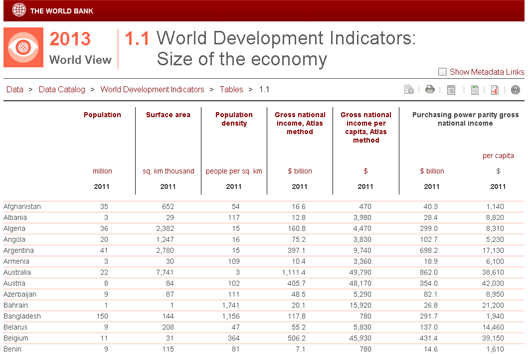
1. New on-line tables. All data tables previously published in the book will now be available on-line from mid-April, with the same comprehensive “about the data” explanations, with tables that work in web browsers as well as PDF-format downloads for those that prefer a paper copy. This change brings many advantages: they will reflect the latest revisions to the estimates consistent with the on-line database, they will be available to a far greater audience, notes and footnotes will be attached to individual values, and the tables will be free for everyone.
2. A new look for the print edition. The WDI book will still use the same six sections -- world view, people, the environment, the economy, states and markets, and global links -- but the content of each section will be redesigned to include an introduction, a new set of six stories highlighting regional trends, a table of the most relevant and popular indicators, and a new index to the full set of tables and indicators available on-line. The print edition will be free to download electronically, and the paper-based version will be available for sale, but at a much lower price than previous years. Since most tables will be on-line, it’ll be lighter and more convenient to carry, too.

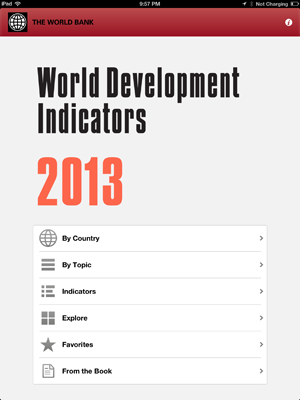
3. An improved mobile application. We’re enhancing the “DataFinder” app, to better reflect the structure and navigation of the WDI, and include more pre-defined indicator selections. Taking advantage of the multilingual WDI database, it’ll be available in English, Spanish, French and Chinese, in tablet and mobile phone editions for both Android and iOS. Here are the apps currently available, but check back in April for the new versions. In the meantime, here’s a screenshot from a test version.
4. Improved on-line access to notes “about the data”. Each table in the print volume of the WDI has meticulous notes “about the data”, explaining the relevance of the indicators for development, their source, and the methods used to calculate estimates. This is of course extremely useful information, and so this year these notes will be available from on-line sources as well, including the new online tables, the data website indicator pages, and new Databank system. Harvesting those metadata, and formatting it for each indicator - rather than each table - has been a surprisingly big task!
5. The companion Little Data Book will be published at the same time as the WDI, to provide an at-a-glance view of indicators for each economy in booklet form.
6. Lastly, we’ve discontinued production of the CD-ROM. Demand has dropped dramatically, though we’re aware that it still has a following among a few important user groups. But the good news is that both the new DataBank web application and DataFinder mobile application allow users to create and save reports. We hope that CD-ROM users will be able to make the switch as easily as possible.
So what’s motivated these changes? First, let’s recap the history of the WDI. Its origin can be traced back to 1966, when the World Bank’s Economics Department started to publish statistics on global development through a digest called the World Bank Atlas, drawing on a database called “World Tables”. In 1978, the first World Development Report was published, containing an annex of statistical tables - the first World Development Indicators. In 1997, WDI was published as a standalone volume - with a format that’s been used up to 2012 - together with an electronic database that supports a number of other products.
But over the last few years there have clearly been dramatic changes in the way that people acquire and use knowledge, information, and data. At the time of the first edition of WDI in 1997, the number of mobile phones worldwide was estimated to be less than 2 for every 100 people; the latest edition reports that mobile phone subscriptions in 2011 were around 85 for every 100 people – more than a forty-fold increase. And WDI has experienced the revolution directly, with large increases in the use of the on-line database and the tools that access it, including applications designed for mobile devices. We’ve also seen increases in access to ebooks and other on-line products, but the previous design of the book doesn’t really lend itself to a pdf (the 2012 edition was over 450 pages, for example). And of course sales of published paper products are declining, consistent with publishing industry trends.
We believe that the changes we’re making will provide a better platform to respond to these trends, and will offer substantial improvements for users. We’d love to know more about what you, our users, think: how you use any of the WDI products, and what you’d like to see in future versions. We look forward to hearing from you.


Join the Conversation