 The Bình Thạnh District of Ho Chi Minh City
COP26 may be in our rearview mirror, but the reality that it underscored is not.
The Glasgow Pact, a result of the climate meetings in November, emphasizes the need for much deeper emissions cuts, noting that without major decarbonization efforts, the world will cross the 1.5° C threshold for global warming, and risk catastrophic impacts on people and ecosystems.
The conclusions of COP26 present a critical opportunity to reflect on the role cities play in contributing to greenhouse gas emissions (GHGs). Identifying the sources of these emissions, along with ways to accurately measure and monitor them, is a first step toward reducing them in a meaningful manner.
Investing in low-carbon and resilient urban development will be key to cutting city emissions and dealing with climate change
Cities account for over 70% of global CO2 emissions, most of which come from industrial and motorized transport systems that use huge quantities of fossil fuels and rely on far-flung infrastructure constructed with carbon-intensive materials. Clearly, staying below the 1.5° C threshold means massive decarbonization of cities, which will require investments in low-carbon energy and transport systems, programs to reduce urban sprawl, and nature-based solutions for urban cooling and disaster risk management. To that end, World Bank's latest Climate Change Action Plan (2021–2025) recognizes city systems as one of five key systems that generate the most GHG emissions and face significant adaptation challenges.
Assessing decarbonization progress requires new metrics, because not all cities are the same
Rapid decarbonization will need to be promoted or rewarded by emissions-based performance ratings that make urban governments and businesses more accountable to their stakeholders. However, effective performance measures cannot ignore the effects of differing demographic, economic, and geographic conditions on actual CO2 levels in cities.
Many older cities have inherited carbon-intensive infrastructure. More populous cities have more emissions, while higher-income cites have fewer emissions-intensive heavy industries. Higher-income cities have higher land costs and stricter pollution regulations; and cities in particularly cold or hot climates produce more emissions from energy for heating or cooling. Decarbonization by different cities must be rated against benchmarks that account for these innate differences.
New metrics will require more accurate and objective CO2 measures
Assessing city progress on emissions reductions has been hindered by the near-total absence of directly measured CO2 emissions data. Consistently measured emissions estimates are only available for about 80 cities, only half in developing countries. What’s more, hardly any estimates are based on actual emissions. Most estimates rely on parameters from engineering studies that are applied to survey-based activity measures for transport, energy production, and manufacturing. They are particularly suspect for developing countries, since many of the measures are calibrated using databases and models from high-income economies.
The advent of satellite-based CO2 measurement has greatly expanded the scope for emissions-performance ratings. We demonstrate the potential in a recently published working paper that uses data from NASA’s OCO (Orbiting Carbon Observatory)-2 platform to measure CO2 emissions from more than 1,200 cities in 138 countries, with populations greater than 500,000.
Using satellite data to assess whether a city is under or overperforming on reducing CO2 levels
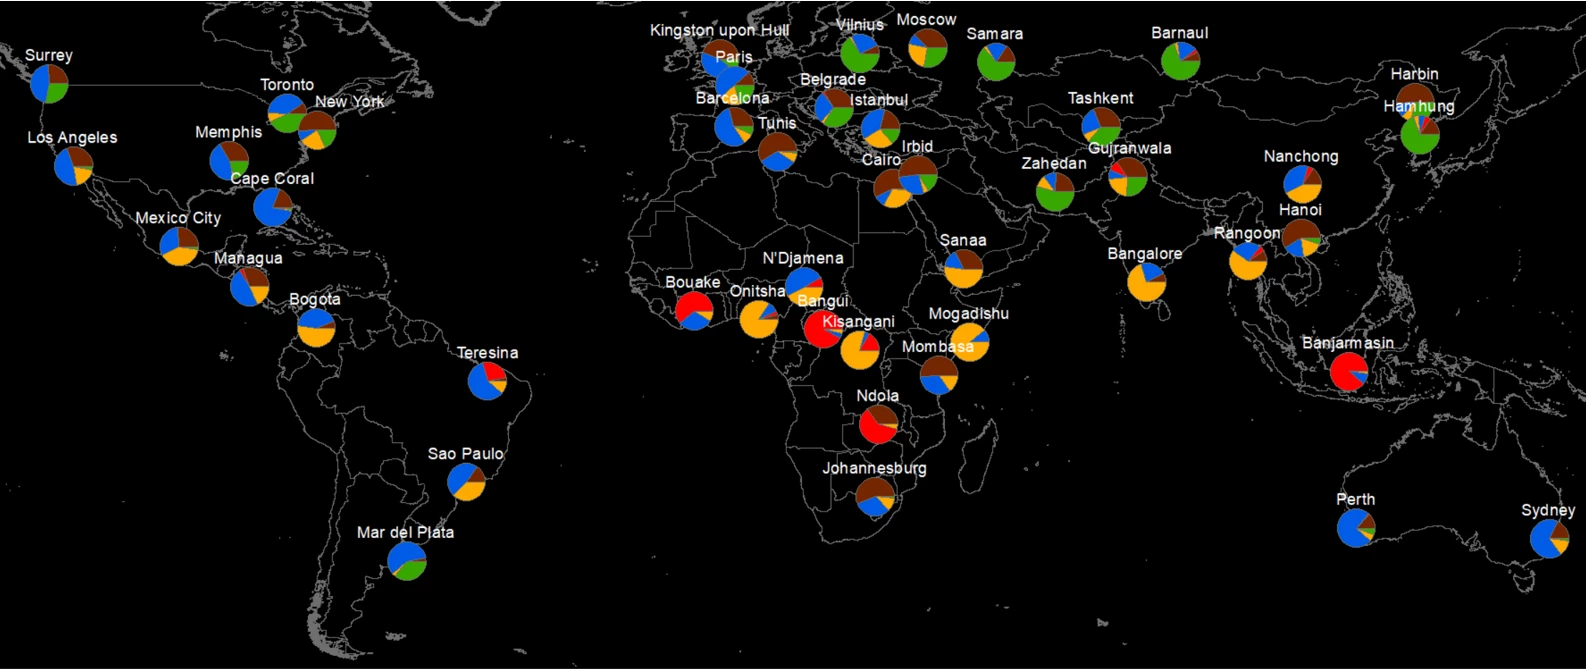
Our research uses a predictive econometric model that estimates cities’ expected CO2 emissions from their demographic, economic and geographic characteristics. The first image, below, draws on the results of the paper to illustrate the relative contributions of these differences to CO2 emissions from many of the sample cities. (The charts are presented at uniform scale for ease of comparison.) Cities’ emissions performance is measured as the difference between their expected emissions, given their innate differences mentioned earlier, and their actual emissions as measured by satellite observations.
Figure 1: Econometrically estimated CO2 emissions sources for sample cities
|
|
As this next image shows, there are wide performance variations within and across regions. In general, city performance exceeds expectations (emissions below predictions) in India, Western Europe, and the former Comecon countries, while it falls short in China, the rest of East Asia & Pacific, the Middle East & North Africa, and sub-Saharan Africa.
Figure 2: City emissions performance by region*
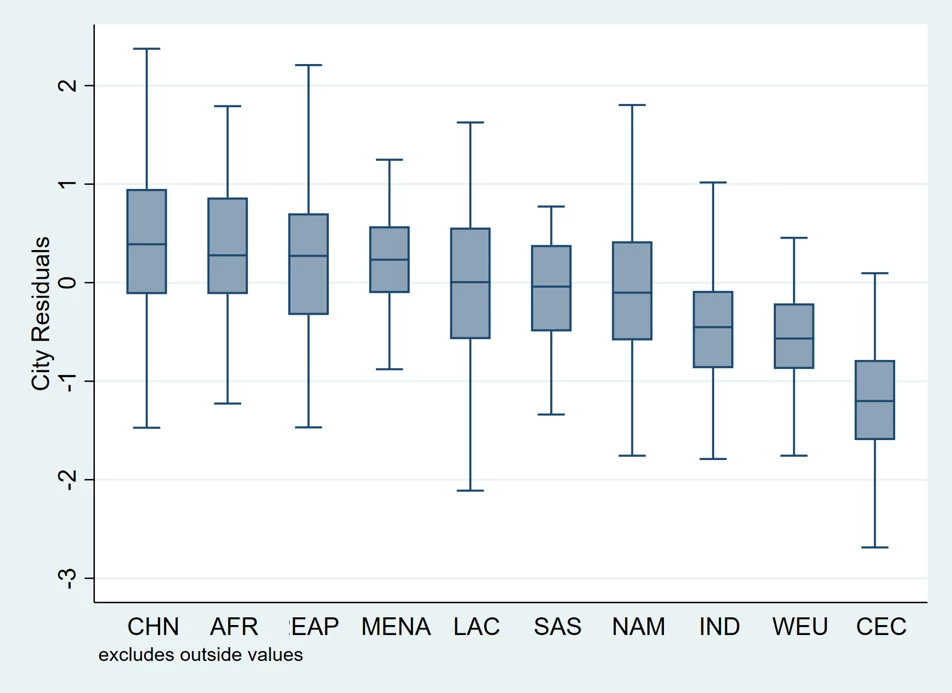
*Legend: CHN - China; AFR - Sub-Saharan Africa; EAP - East Asia & Pacific (excluding China); MENA - Middle East & North Africa; LAC - Latin America & Caribbean; SAS - South Asia (excluding India); NAM - North America; IND - India; WEU - Western Europe; CEC - Former Comecon countries (Former Soviet Union, Eastern Europe)
Future directions for assessing how cities are performing
The World Bank’s research suggests that satellite-based CO2 measures can provide valuable support for analyzing and assessing urban emissions performance. While the study has focused on large cities, the same modeling approach can be used in geographic settings as varied as large and small cities within regions or countries, regions within countries, or specific project areas.
There is also potential to explore how such data can be developed through an open-source, regularly updated database that will support more applications of this kind. Our hope is that we can build a deeper understanding and ability to more accurately monitor country and city efforts to cut emissions toward meeting the goals of the Paris Agreement and those made more recently in Glasgow.


Join the Conversation