Technological content of India’s exports
The evolution of Indian exports has not followed a “textbook” pattern. The pattern of evolution points to a dichotomy in the Indian economy – a well integrated, technologically advanced services sector and a relatively lagging manufacturing sector. The share of service exports in total exports has grown to over 32 percent in 2013 from 28 percent in 2000. On the other hand, the share of manufacturing exports in total export has declined to 67 percent from nearly 80 percent during 1990-2013.
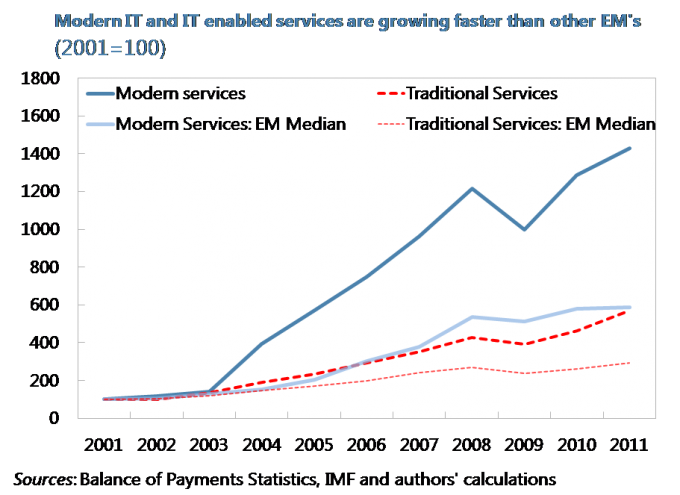
The growth in service exports has been more rapid, resulting in the share of services exports in total exports to increase rapidly over the last decade. This can be explained by technological changes. Many services do not require face-to-face interaction, and can be stored and traded digitally. These services are called modern services. Modern services are the fastest growing sector of the global economy. This is particularly evident in India, where modern services exports account for nearly 70 percent of the total commercial services exports (compared to around 35 percent in EMs) (see Figure 1).
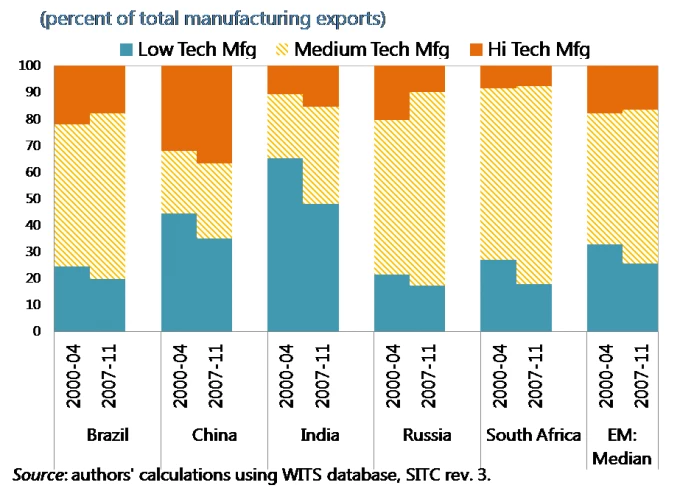
Within manufacturing exports, there is a clear shift away from traditional exports, such as textiles, gems, and leather products, towards high-tech and medium-tech manufacturing products. The relative share of high-tech manufacturing exports has been increasing (however lower when compared to China or other EMs); Resource based production and low-tech manufacturing dominate the goods export basket (Figure 2).
Manufactured machinery accounts for almost 10 percent, while textile and garments account for more than 15 percent of India’s merchandise exports. In resource-based products – refined petroleum oil, cotton, jewelry of precious metals, and rice – constitute majority of export. In low-tech manufacturing exports – jewelry, textile and apparel based exports constitute the majority of India’s exports. In medium-tech manufacturing – the automotive industry dominates the basket, with machinery, various motor vehicle intermediary inputs for cars, bikes, construction, mining equipment and cosmetics making up the major portion. In the high technology export basket – veterinary and pharmaceutical products, television, telecommunication transistors, aircraft components, X-ray equipment and electronic R&D in electro-medical, power and automotive industry are key elements of the export basket. The main contribution of our work is to comprehensively document Indian exports, which has not been done over the past decade.
Direction of India’s exports
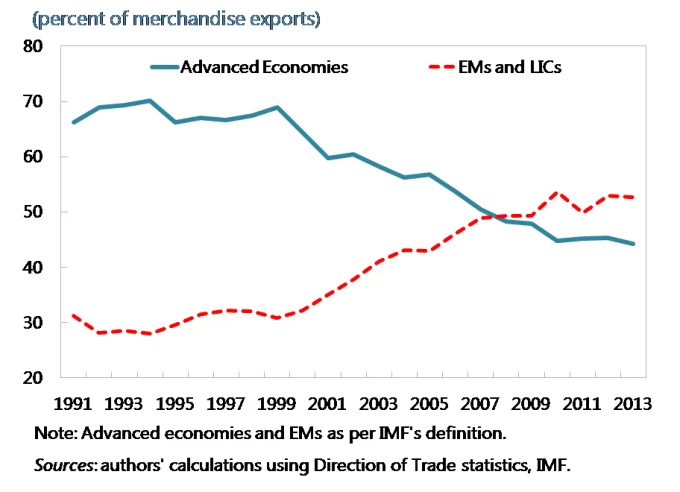
In line with global trends, Indian exports exhibit a shift toward emerging and developing economies. The share of exports to the EU and the USA fell to around 29 percent in 2013 from over 45 percent in 2000. East Asia and the Middle East have emerged as the top two regional destinations. Exports from India to the Middle East have grown rapidly in the last decade, though some of these exports may be re-routed to other countries (in particular to Pakistan).
Quality of India’s exports
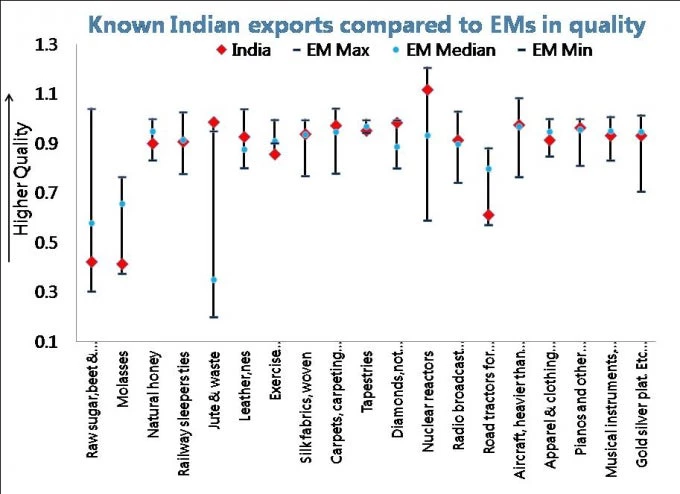
Figure 4 compares the quality of selected exports from India with peer-EMs. Indian exports of diamonds, nuclear reactors, tin and alloys are of better quality than peer-EMs; however, on most other goods, including its highest quality exports, India does not fare as well when compared to its peers.
Relatedness and Complexity of India’s Exports
As countries change their export mix, there is a strong tendency to move towards goods that are more closely related to ones already being produced rather than to goods that are less closely related. We use the product space network to study the evolution of India’s export structure by observing the location of products in which India has revealed comparative advantage (Revealed Comparative Advantage > 1 are denoted with colors). Figure 5 presents India’s product space network of merchandise exports in 2013.
Two clear trends are visible: the number of products in which India has comparative advantage has increased and the core of the product space has become more populated (blue nodes) which include hi-tech manufactured products. The network exhibits heterogeneity with the core of the network consisting of metal products, machinery, and chemicals, whereas the periphery is formed by fishing, tropical, and cereal agriculture. It also shows that apparels and textiles have lead to comparative advantages in related products such as fabrics, leather, fashion, garment technology exports (green nodes).

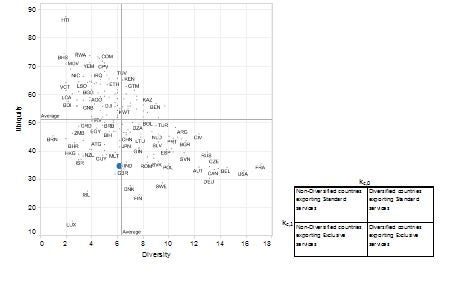
Empirically observed average diversification of a country and ubiquity
Policy Considerations
Based on our comprehensive analysis on the evolution of India’s export and its future prospects, there are five priority areas for policies that we identify: (1) reduction of trade costs, at and behind the border; (2) further liberalization of FDI including through simplification of regulations and procedures; (3) improving infrastructure including in urban areas to enhance manufacturing and services in cities; (4) preparing labor resources (skills) and markets (flexibility) for the technological progress that will shape jobs in the years ahead; and (5) creating an enabling environment for innovation and entrepreneurship to draw the economy into higher productivity activities.
References
Anand, Rahul, Kalpana Kochhar, and Saurabh Mishra, 2015, “Make in India: Which Exports Can Drive the Next Wave of Growth?” IMF Working Paper No. 15/119. (Washington: International Monetary Fund).

Join the Conversation