But how confident are we that the available data on economic activity paints an accurate picture of a country’s performance?
Measuring Gross Domestic Product (GDP), the most standard measure of economic activity, is especially challenging in developing countries, where the informal sector is large and institutional constraints can be severe.
In addition, many countries only provide GDP measures annually and at the national level. Not surprisingly, GDP growth estimates are often met with skepticism.
New technologies offer an opportunity to strengthen economic measurement. Evening luminosity observed from satellites has been shown to be a good proxy for economic activity.
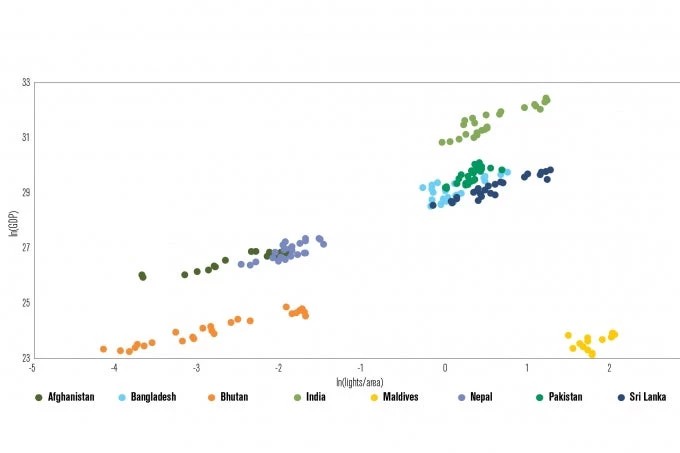
As shown in Figure 1, there is a strong correlation between nightlight intensity and GDP levels in South Asia: the higher the nightlight intensity on the horizontal axis, the stronger the economic activity on the vertical axis.

However, measuring nightlight is challenging and comes with a few caveats. Clouds, moonlight, and radiance from the sun can affect measurement accuracy, which then requires filtering and standardizing.
On the other hand, nighlight data has a lot advantages like being available in high-frequency and with a very high spatial resolution. In the latest edition of South Asia Economic Focus, we use variations in nightlight intensity to analyze economic trends and illustrate how this data can help predict GDP over time and across space.
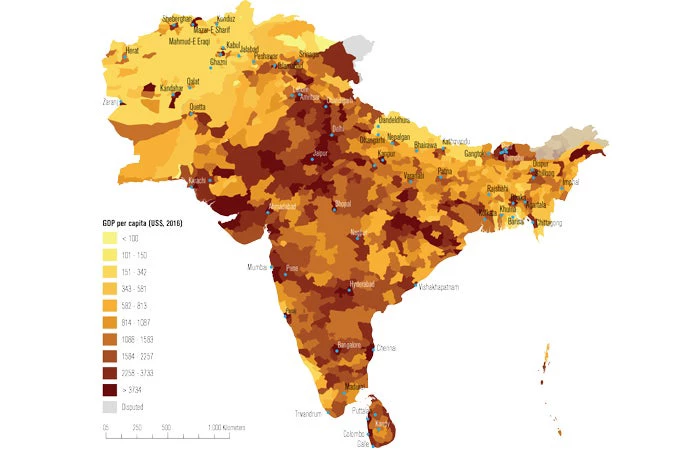
We show that in the case of South Asia, predicted GDP numbers using nightlight intensity closely track official National Account measures at the aggregate level, and – as shown in Figure 2 – provide a granular picture of GDP per capita at subnational levels.

While providing new economic insights, big data from outer space is no replacement for more traditional – and terrestrial - statistical measurement.
New technologies can help reach new frontiers, but they cannot replace information gathered from censuses, surveys and administrative records that statistical agencies collect, curate and disseminate.
Unfortunately, many of these statistical agencies face important challenges. Surveys do not cover the informal sector well, respondents are not always truthful, and information is not captured with sufficient spatial granularity.
Resources and capacity are limited, and in some cases, technical independence, access to information, and the protection of privacy need to be improved.
Building trust that growth figures do not come “out of the blue” will require a clear strategy toward stronger statistical systems.


Join the Conversation