We are delighted that Dave Evans has agreed to be a semi-regular contributor to this blog, agreeing to post about once a month. David is a Senior Economist in the Chief Economist's Office for the Africa region of the World Bank, and coordinates impact evaluation work across sectors in the Africa region.
In the fall, I participated in a seminar where Ed Seidman from NYU presented a novel instrument for classroom observation, the Teacher Instructional Practices and Processes System (or TIPPS), which is being used in education impact evaluations in the DRC and in Uganda. At the same time, the World Bank has invested big in classroom observation around Latin America, as the Gates Foundation has in the United States, and others have elsewhere.
As happens every time classroom observations are presented, someone brought up the Hawthorne effect (or, my preferred and less obscure term, observer effect): But won’t the teachers act differently since you’re watching them? Since this is a part of many education, health, and other impact evaluations today, I looked into it.
Was there actually a Hawthorne effect at the Hawthorne Plant? Yes and no.
You probably know the story. In the 1920s, a series of experiments were carried out at Western Electric’s Hawthorne Plant in Cicero, Illinois, to see whether better lighting increased worker productivity. It did! But each time the level of light was changed, worker productivity went up. When the original poor lighting was restored, productivity went up! Over the next decade, other changes were tested (the length of the workday, the length of breaks) and each experiment had a positive impact. This gave rise to what we call the Hawthorne effect, “a positive change in the performance of a group of persons taking part in an experiment or study due to their perception of being singled out for special consideration.”
Levitt & List (2011) recount the above and the fact that several researchers have gone on to study later rounds of experiments at the Hawthorne Plant and have been unable to replicate anything like the Hawthorne effect: Franke & Kaul (1978) write that “the unmeasured supervisory…variables were not very important economically,” and Jones (1993) writes “little or no evidence of Hawthorne effects was found.” But L&L argue that the myth of the Hawthorne effect really arose from the original lighting experiment: “It is the illumination studies that are the genesis of the popular claims that whenever light was manipulated, whether upward or downward, output increased.” For a long time, people thought that the original lighting experiment data had been destroyed, but L&L managed to find it on microfilm, buried in a university library.
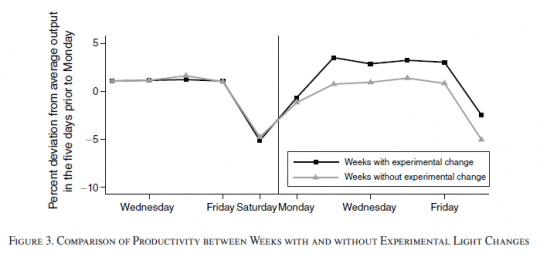
What really happened? Productivity did rise when the lighting changed. BUT that was only because the lighting was always changed on Sundays (the workers’ day off), and workers were more productive on Mondays than later in the week. It turns out that Mondays without light changes were just as productive, so researchers were confounding day-of-week effects with the Hawthorne effect (as in the figure below). BUT (always another “but” in this tale) (1) productivity increases were higher in the part of the plant where experimentation was happening than in the rest of the plant, (2) output was higher in the periods when experimentation was happening than when it wasn’t (again, visible in the figure below), and (3) fluctuations in output related to the experimental (artificial) lighting were greater than those associated with natural changes in lighting (from weather). All of these, together, suggest there was some kind of observer effect, just not the one recounted in the usual fable.
What do we really mean when we talk about the Hawthorne effect?
L&L nicely delineate three separate potential things we might be talking about:
2. The effect of experimental treatment: Changes in the treatment or repeated roll-outs (think monthly cash transfers) remind the treatment group that they are in an experiment.
3. The desire to please the experimenter: Experimental subjects may try to act in a way that pleases the experimenter.
Has anyone measured it? The most common test of the Hawthorne effect is to have two control groups, a “Hawthorne control group” and a “pure control group.” The Hawthorne control group doesn’t receive the intervention but does participate in all of the data collection of the study. The pure control group doesn’t know it’s in the study at all. A recent (near) example of this in education is
Muralidharan & Sundararaman (2011)’s experiment with teacher bonus pay in India. They had 400 treatment schools (spread across 4 treatments) and 100 control schools, all of which took a baseline test, had regular classroom observation, and took an end-of-year test (and received a diagnostic report on each test). In the control schools, the tests and observation had no stakes. So these 100 control schools would be subject Hawthorne Effect 1 above (they were in an experiment), HE2 (multiple visits reminded them that they were in the experiment), and maybe even HE3 (control teachers want to please the observers in the classroom observation).
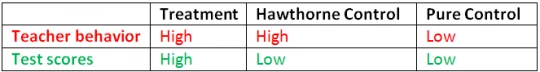
But in this study there was also a “pure control group”, which took no baseline test – M&S rely on the randomization to deliver balance – had a single unannounced attendance check, and the final test. In this case, HE1 and HE2 are limited, although one can still imagine HE3 showing up in the one classroom observation. The comparison of Hawthorne control to Pure control is published as a separate study, comparing low-stakes monitoring to nothing. Interestingly, treatment schools (with bonus pay linked to student test scores) and Hawthorne control schools looked identical in terms of observed teacher behavior. But test scores were significantly higher in treatment schools and were identical in the Hawthorne control schools and the Pure control schools (as in the table below). The authors conclude that evaluating the program on teacher behavior (as a proxy for test scores) would be completely biased, due to strong evidence of Hawthorne effects.
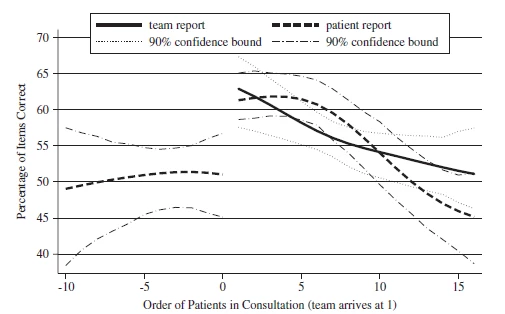
In health, Leonard and Masatu (2006) carried out a study in Tanzania in which they observe the quality of clinician-patient interactions. Using retrospective patient reports, they gather data on the quality of interactions that occurred before the research team arrived at the clinic and after, in the course of a day. There is a sharp uptick in quality when the research team arrives (after a roughly steady level of quality in the run-up to the arrival). Again, this really looks like a strong Hawthorne effect.
What can we do about it?
Earlier studies have tried a number of solutions, with mixed results. A 1989 review ( Adair et al.) of efforts to manage the Hawthorne effect in 86 education studies, either by giving the Hawthorne control group some irrelevant activity (i.e., so they have the same level of attention but without the substance) or a subset of treatment (i.e., treatment light). By comparing the Hawthorne control group to a true control group, the studies attempted to measure the Hawthorne effect. They didn’t find much, but this could be from looking in the wrong place: Remember that M&S in India found no effect on test scores, but they found a strong effect on teacher activities. Likewise, L&M in Tanzania found their effect through patient reports of clinician activities; those may not have shown up if only health outcomes were measured.
So what can we do?
In the fall, I participated in a seminar where Ed Seidman from NYU presented a novel instrument for classroom observation, the Teacher Instructional Practices and Processes System (or TIPPS), which is being used in education impact evaluations in the DRC and in Uganda. At the same time, the World Bank has invested big in classroom observation around Latin America, as the Gates Foundation has in the United States, and others have elsewhere.
As happens every time classroom observations are presented, someone brought up the Hawthorne effect (or, my preferred and less obscure term, observer effect): But won’t the teachers act differently since you’re watching them? Since this is a part of many education, health, and other impact evaluations today, I looked into it.
Was there actually a Hawthorne effect at the Hawthorne Plant? Yes and no.
You probably know the story. In the 1920s, a series of experiments were carried out at Western Electric’s Hawthorne Plant in Cicero, Illinois, to see whether better lighting increased worker productivity. It did! But each time the level of light was changed, worker productivity went up. When the original poor lighting was restored, productivity went up! Over the next decade, other changes were tested (the length of the workday, the length of breaks) and each experiment had a positive impact. This gave rise to what we call the Hawthorne effect, “a positive change in the performance of a group of persons taking part in an experiment or study due to their perception of being singled out for special consideration.”
Levitt & List (2011) recount the above and the fact that several researchers have gone on to study later rounds of experiments at the Hawthorne Plant and have been unable to replicate anything like the Hawthorne effect: Franke & Kaul (1978) write that “the unmeasured supervisory…variables were not very important economically,” and Jones (1993) writes “little or no evidence of Hawthorne effects was found.” But L&L argue that the myth of the Hawthorne effect really arose from the original lighting experiment: “It is the illumination studies that are the genesis of the popular claims that whenever light was manipulated, whether upward or downward, output increased.” For a long time, people thought that the original lighting experiment data had been destroyed, but L&L managed to find it on microfilm, buried in a university library.
What really happened? Productivity did rise when the lighting changed. BUT that was only because the lighting was always changed on Sundays (the workers’ day off), and workers were more productive on Mondays than later in the week. It turns out that Mondays without light changes were just as productive, so researchers were confounding day-of-week effects with the Hawthorne effect (as in the figure below). BUT (always another “but” in this tale) (1) productivity increases were higher in the part of the plant where experimentation was happening than in the rest of the plant, (2) output was higher in the periods when experimentation was happening than when it wasn’t (again, visible in the figure below), and (3) fluctuations in output related to the experimental (artificial) lighting were greater than those associated with natural changes in lighting (from weather). All of these, together, suggest there was some kind of observer effect, just not the one recounted in the usual fable.
What do we really mean when we talk about the Hawthorne effect?
L&L nicely delineate three separate potential things we might be talking about:
1. The effect of being observed (e.g., the scrutiny in the context of data gathering) in the context of an experiment: This would affect both treatment and control.
2. The effect of experimental treatment: Changes in the treatment or repeated roll-outs (think monthly cash transfers) remind the treatment group that they are in an experiment.
3. The desire to please the experimenter: Experimental subjects may try to act in a way that pleases the experimenter.
Has anyone measured it?
But in this study there was also a “pure control group”, which took no baseline test – M&S rely on the randomization to deliver balance – had a single unannounced attendance check, and the final test. In this case, HE1 and HE2 are limited, although one can still imagine HE3 showing up in the one classroom observation. The comparison of Hawthorne control to Pure control is published as a separate study, comparing low-stakes monitoring to nothing. Interestingly, treatment schools (with bonus pay linked to student test scores) and Hawthorne control schools looked identical in terms of observed teacher behavior. But test scores were significantly higher in treatment schools and were identical in the Hawthorne control schools and the Pure control schools (as in the table below). The authors conclude that evaluating the program on teacher behavior (as a proxy for test scores) would be completely biased, due to strong evidence of Hawthorne effects.
In health, Leonard and Masatu (2006) carried out a study in Tanzania in which they observe the quality of clinician-patient interactions. Using retrospective patient reports, they gather data on the quality of interactions that occurred before the research team arrived at the clinic and after, in the course of a day. There is a sharp uptick in quality when the research team arrives (after a roughly steady level of quality in the run-up to the arrival). Again, this really looks like a strong Hawthorne effect.
What can we do about it?
Earlier studies have tried a number of solutions, with mixed results. A 1989 review ( Adair et al.) of efforts to manage the Hawthorne effect in 86 education studies, either by giving the Hawthorne control group some irrelevant activity (i.e., so they have the same level of attention but without the substance) or a subset of treatment (i.e., treatment light). By comparing the Hawthorne control group to a true control group, the studies attempted to measure the Hawthorne effect. They didn’t find much, but this could be from looking in the wrong place: Remember that M&S in India found no effect on test scores, but they found a strong effect on teacher activities. Likewise, L&M in Tanzania found their effect through patient reports of clinician activities; those may not have shown up if only health outcomes were measured.
So what can we do?
- Try to test for it, as M&S did in India, building a set of pure control units into the study. (I know of one ongoing education evaluation in Latin America where that is taking place.)
- Recognize that we’re still learning something, even in the context of Hawthorne effects. We may not be learning exactly what health and education professionals (for example) do when they aren’t observed, but we may be learning about the upper bound of their knowledge frontier, which could be useful in identifying binding constraints on performance.
- The Tanzania study suggests that the Hawthorne effect wears off: In their case, it takes 10 to 15 observed consultations. So if we’re going to observe clinicians or teachers, we should make sure to stick around for a while, and perhaps trust the last observations more than the first as a reflection of actual behavior.
Last year, David McKenzie
discussed the invisible cousin of the Hawthorne effect, the John Henry effect. Unlike the Hawthorne effect, the John Henry effect really doesn’t look too serious. One fewer thing for you to worry about.

Join the Conversation