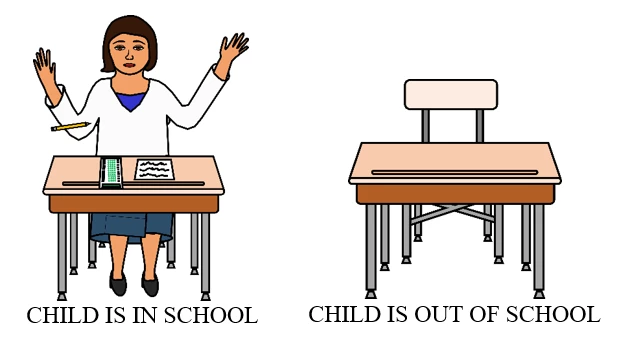
"In 2016, 61 million children of primary school age...were not in school, along with 202 million children of secondary school age." That's a tragic number, and it's also a concrete image. While we may have trouble envisioning 61 million children, we have a clear picture in our heads as to what a child not in school looks like, and we have a picture of what it looks like to have a child formerly not in school now in school.
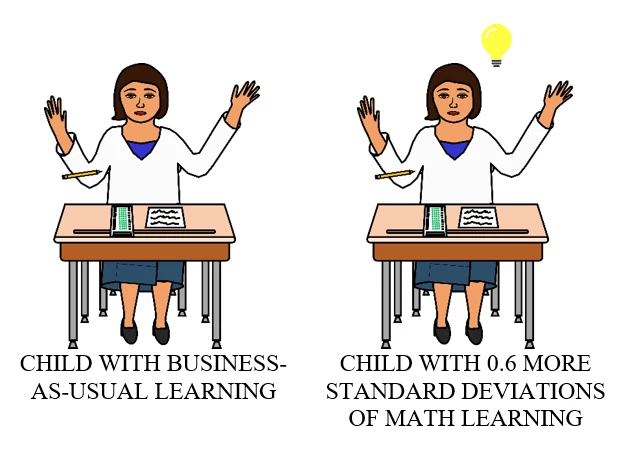
But what about learning? What does improved learning look like? There are lots of studies that examine how to improve learning in low- and middle-income countries. Some report striking learning gains: A technology-aided instruction program in India finds that participation for 90 days would increase math scores by ... 0.6 standard deviations. For the vast majority of people in the world, the first response to that would be, "What's a standard deviation?" Even for educationists and economists, it's hard to envision the difference between the child with and without 0.6 standard deviations additional mathematical learning. (FYI, 0.6 standard deviations is a big learning gain.)
The health researchers have us beat, with their disability-adjusted life years, or DALYs. When someone writes that malaria leads to 111,000 disability-adjusted life years lost in Latin America each year, a compelling image comes to mind of more than 100,000 people dying a year earlier. Of course, that's not precisely right: it includes years lost to disability due to the illness, and it may be concentrated in a much smaller number of people. But the metric is useful for communicating the benefits of health interventions to a broad public audience. These measures get used, both in academic work -- the first publication of the DALYs now has more than 12,000 citations -- and in the popular press, as the press clippings below demonstrate. 
In a new paper – “Equivalent Years of Schooling: A Metric to Communicate Learning Gains in Concrete Terms” – we propose that in addition to reporting standard deviations, we can report those learning gains relative to how much a student would normally learn over the course of a school year. If a child would normally improve her math score by 0.5 standard deviations over the course of a school year, and a program improves math scores by 0.25 standard deviations, then that program has improved learning by half an “equivalent year of schooling” (or 0.5 EYOS). In other words, the program increased learning by as much as a child would have learned over the course of half a year of “business-as-usual” schooling. We then look at how a range of learning interventions fare in terms of EYOS and how much of a gain in lifetime earnings that could translate into.
How much does a child learn from year to year?
Imagine if we had a common test (or at least a test with an overlapping set of test questions) that students took each year. We could then use that to construct how much students learn from year to year. Simple! Only, that test exists almost nowhere (with the exception of a few school districts in high-income countries). So instead, in an occasional study, researchers have tried to construct how much students learn in a business-as-usual setting in a couple of different ways. In some impact evaluations, researchers use the learning gains from the students in the control group to gauge business-as-usual learning. In other cases, researchers have used the international assessment (PISA) which is administered to 15-year-olds around the world, and compared 15-year-olds in different grades. Across countries, this poses the problem that 15-year-olds in 9th grade might be different from 15-year-olds in 10th grade for a variety of reasons. In individual countries, researchers have used enrollment cut-off dates to more accurately measure the gains.
We propose a novel measure that draws on data from five low- and middle-income countries (Bolivia, Colombia, Ghana, Kenya, and Vietnam) and measures learning levels among adults who have completed different number of years of schooling. (These are the STEP Skills Measurement Data.) So in the simplest approach, we compare how well adults who completed just one year of schooling can read to how well those who completed two years of schooling can read, to the competency after three years, four years, and so on up to twelve. (We stop at twelve because we observe that there are significant gains in reading ability up to twelfth grade in our sample countries.) We then do a (very slightly) more complicated measure (the “adjusted” approach) that adjusts for age and gender. We find that in these school systems, on average, one standard deviation in learning is the equivalent of between 4.7 and 6.5 years of schooling.
How much do learning interventions really matter?
Sometimes we hear that many of the learning interventions that governments and donors are trying have tiny magnitudes. So we translated the impacts from three categories of interventions – structured pedagogy interventions (i.e., providing detailed lesson guides and training to teachers), computer assisted learning interventions, and school-based management interventions. In the figure below, we show the EYOS gained from the median intervention in each category, as well as an intervention close to the top in effectiveness (75th percentile) and one closer to the bottom (25th percentile). As you can see, even with the most conservative measure (the adjusted profile, in yellow), the median structured pedagogy intervention delivers more than half a year’s worth of learning relative to business-as-usual schooling. The more effective structured pedagogy interventions are closer to 1.5 years of learning.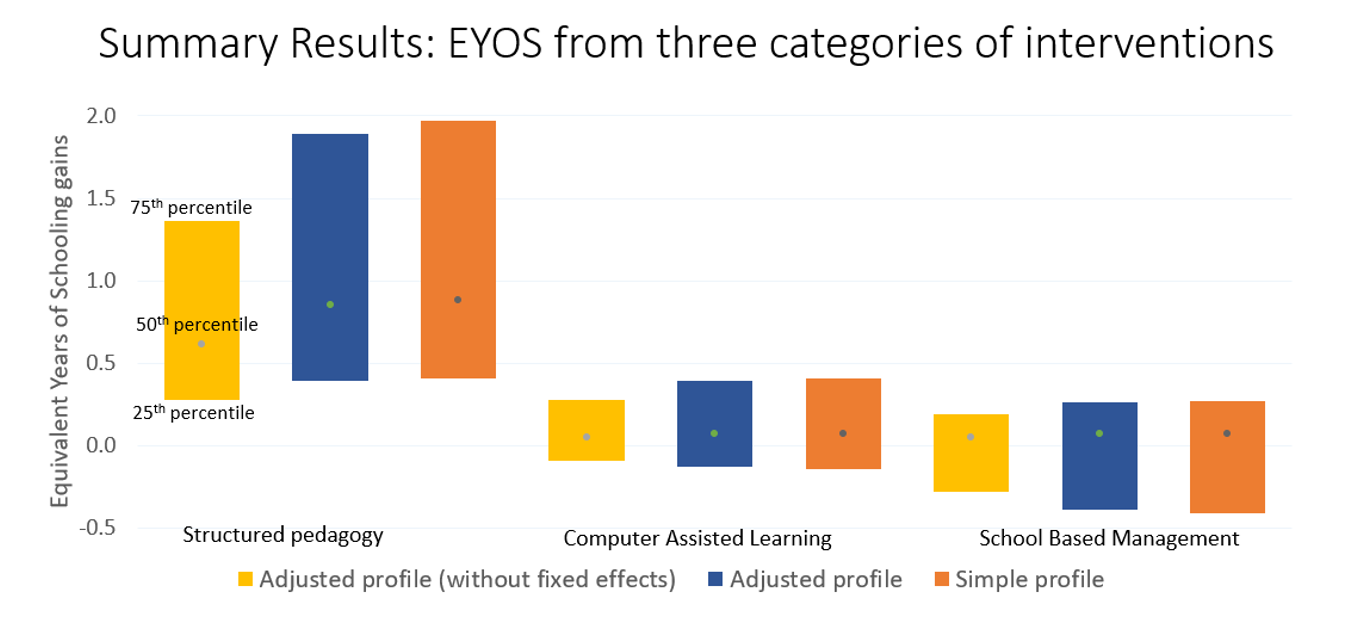
When we go on to compare the relative earnings of individuals with different levels of learning, we can give a sense of how much more people who benefit from these learning interventions are likely to earn. We find that there are learning interventions that will have a significant impact on lifetime earnings if student retain the learning gains. For example, a teacher professional development program in Kenya would translate into an 8 percent change in lifetime earnings. A curriculum reform program in Brazil would translate into a 21 percent change in lifetime earnings. These are nontrivial gains.
There are obvious assumptions and limitations at play here, discussed in detail in the paper. Some learning gains may disappear over time; others may be magnified. We only have data from five countries, and obviously conditions vary dramatically both across those countries and in all the other low- and middle-income countries. The tests used to measure learning gains from interventions are often different from the tests we used to construct the equivalent years of schooling, although we do robustness checks in which we restrict our analysis to impact evaluations with similar kinds of tests. These limitations are real: but the health sector’s disability-adjusted life years are also based on strong assumptions and limited data, and they have nevertheless been useful in enabling a broader discussion of health interventions and their impacts. We can’t let the nonexistent ideal be the enemy of the doable useful.
Take aways:
- A number of interventions boost learning as much as multiple years of business-as-usual education: There are interventions that work.
- This is true regardless of method. But the magnitudes depend on the assumptions.
- Learning gains can be presented simply and intuitively, permitting the impact of education interventions to be discussed by policymakers and donors, not just specialists.


Join the Conversation