- Is this a good quality, high visibility journal to publish my work?
Since these were collected last year as well, I provide the impact factor of the journals. The standard impact factor is the mean number of citations in the last year of papers published in the journal in the past 2 years, while the 5-year is the mean number of cites in the last year of papers published in the last 5. This is complemented with RePec’s journal rankings which take into account article downloads and abstract views in addition to citations. The impact factors and RePec ranks are reasonably stable over the two years – with the World Bank Research Observer seeing the biggest jump in impact factor. It publishes the smallest number of articles, so the mean is more likely to be influenced by one or two papers.
Addendum note: WBER notes to me that their Impact factor was pulled down by the inclusion of a papers and proceedings supplement, which more than doubled the number of papers in 2015 included in calculating the impact factor of 1.431 above. Excluding the supplement would increase the impact factor by approximately 0.5, to approximately 1.9.
Of course, mean citations can be skewed by outliers, and publication lags can mean it takes a long time for citations to show up in impact factors. I took the 2016 issues of each journal, and looked up the Google Scholar citations of each paper published. Figure 1 gives a boxplot of the data, sorted by median citation rate, and compared to the development papers in the AER in 2016 as a benchmark. (I took a random sample of half the issues of World Development (WD) and the Journal of Development Studies (JDS), given how many articles they publish).
Figure 1: Boxplot of citations as of March 2018 of articles published in 2016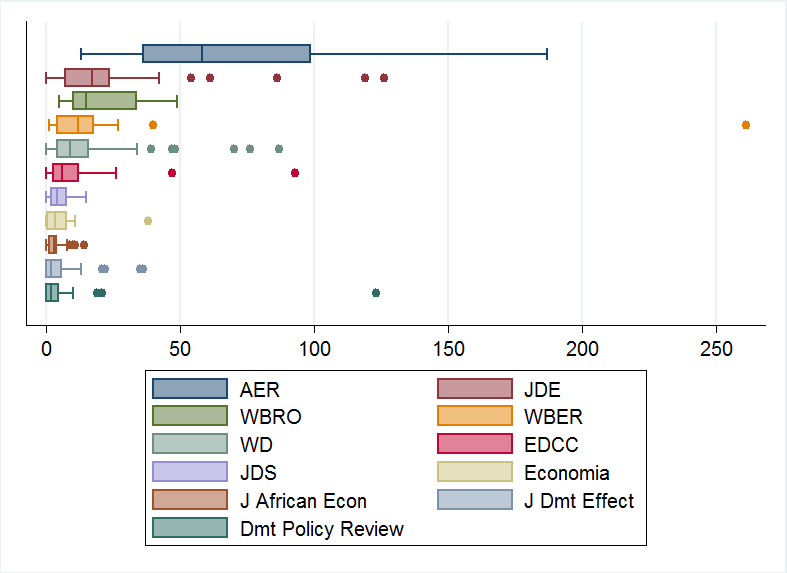
(note: boxes show 25th percentile, median, and 75th percentile).
This figure reinforces a point made in Hamermesh’s new JEL piece on the use of citations – “the tremendous heterogeneity of individual contributions published in the same outlet makes attributing journals’ average quality to the individual articles they published extremely error-prone”. Each one of the development journals I consider above has at least one paper cited more than at least one paper in the AER, and the standard deviation is larger than the mean for eight of ten development journals here.
Another point to note in considering citations is that journals differ a lot in the age of articles by time they reach publication. This depends on how long authors take before submitting the article (perhaps they try other journals first, or spend a long time presenting and polishing), on how long they take to review the paper and how many rounds (see below), and then, once accepted, on what the delay to appearance in an issue is. In particular, some of the journals get accepted papers out in an issue quickly (JDE 3 months; IZA 76 days; Economia 4 months), while several other development journals have a backlog of approved papers and currently take considerably longer (WBER reports an average of 18.5 months; JDS over 12 months; and EDCC currently 18-20 months). These journals do get accepted articles up online and listed as forthcoming sooner, but if we count citations as from the issue date, this can induce considerable differences in how long articles have had to accumulate citations.
2. What are the chances of a paper being accepted?
Table 2 reports the number of submissions received by each journal in 2017, the number of papers published, and the acceptance rate. I added Development Policy Review and Development Engineering this year, while WBRO and the Journal of Development Effectiveness were unable to provide statistics this year. We see the annual number of submissions at each journal was fairly similar in 2017 to 2016, and continues to be massive: over 400 at WBER, EDCC, and the Journal of African Economics; over 1,000 at JDE and JDS; and over 2,000 at World Development. World Development publishes a huge number of papers – 279 in 2017, which is four times the number at JDE and 11 times that at EDCC. Acceptance rates of 5 to 7 percent at WBER, JDE, and Journal of African Economics are similar to the rates at the AER.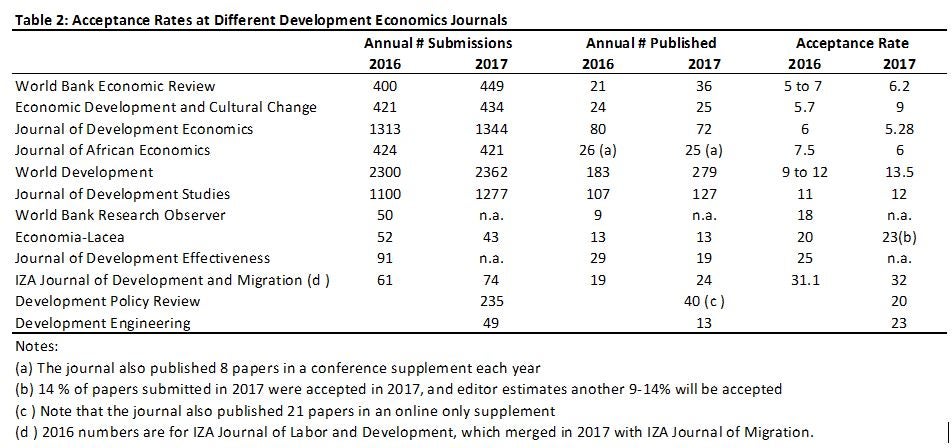
(note that measuring acceptance rates is difficult due to articles spanning years and censoring of papers out for review or in revision status. Different journals address this issue different ways in their reporting, and I just use the acceptance rate reported to me by each journal office. Given that the number of submissions and number of articles published have remained roughly constant over the last two years at many journals, the simple ratio of annual number published to annual number of submissions is a good approximation of the acceptance rate at many journals).
Two questions that came up last year in response to these statistics were 1) do any of the journals charge submission fees – none of them do, but many charge open-access publication fees, which are voluntary with most journals (e.g. $2,400 at World Development), and compulsory with a couple of journals (e.g. Development Engineering); and 2) how many of these submissions reflect a growth in submission numbers from developing countries? I don’t have this historically, but the corresponding author came from a developing country in 28% of submissions to WBER, 51% at Economia, 50% at Development Policy Review, 43% at JDE, and 57% at the IZA JODM. World Development offers this nice map of where submissions in the last 5 years have come from.
3. How long does the review process take at each journal?
Table 3 reports data on how long journals take deciding on papers. This information was the most difficult to obtain from many journals, and it appears that a number of journals do not carefully track standardized metrics on these. The first piece of information I requested was the desk rejection rate. Given the large number of submissions and low overall acceptance rates at many journals, desk rejections are an efficient way to screen out many papers and render quick decisions on them. We see the desk rejection rates at most development journals are more than 50 percent. Using these desk rejection rates, I calculate the approximate acceptance rate conditional on going to referees in the second column – you can see that even if you pass the desk rejection stage, less than one-third of papers sent to referees are accepted at many journals. I then provide the mean time to first decision, and percent refereed in 3 months and 6 months. We see considerable variation here. The most efficient are WBER and JDS.
Of course, time to review depends on referees – it seems at least 2,000 papers were sent to referees last year. I know how painful chasing up referees can be in my limited editing experiences, so pity the poor editors who have to chase up that many reports, and please do your part to referee on time.
4. Who is getting published?
Finally, given all the recent attention in the profession to gender representation and to the need for more diversity, I thought this year I would take a look at some of the characteristics of who is getting published. Table 4 shows that development papers are typically co-authored, with only 20 to 25 percent sole-authored at most development journals. Column 2 then looks at what percent of papers have at least one author located in a developing country: the simple average is 32.5 percent. As someone who studies migration and believes that brain drain fears are overstated, and that you don’t lose your knowledge and identity by hopping on a plane, I really dislike bean-counting measures of developing-country participation that count a person if they reside in a developing country but not if they move to pursue better opportunities abroad. I therefore would much prefer to look at diversity based on place of birth or citizenship, but of course the journal only identifies current institution of authors. Finally, the last column shows that just over half of articles have at least one female co-author (identified based on name, and webpage when name was unclear). Look out tomorrow for a follow-up guest post which looks more into gender and publishing in development.
Final thoughts and caveats
This is the post that takes me longest to put together each year, so hopefully it is useful. It would be fantastic if all journals published annual editor reports like the AER and AEA journals do. In the absence of this, I’m very appreciative of the journal editors and staff who spent their time helping put together these statistics. Last year some of you requested statistics for other journals – I contacted a couple of other development journals suggested, but they did not provide any responses. I decided to keep this restricted to development journals and not consider other field journals that development economists sometimes publish in, or general-interest journals, in order to keep this manageable.
As final takeaways, the above illustrates the tremendous amount of development economics research taking place each year, which is very exciting, but also can make it hard to publish. Hopefully the statistics here will be helpful in deciding where to send your next manuscript, and in making you feel better about the next rejection or next acceptance that you receive.


Join the Conversation