Regression Discontinuity designs have become a popular addition to the impact evaluation toolkit, and offer a visually appealing way of demonstrating the impact of a program around a cutoff. An extension of this approach which is growing in usage is the regression kink design(RKD). I’ve never estimated one of these, and am not an expert, but thought it might be useful to try to provide an introduction to this approach along with some links that people can then follow-up on if they want to implement it.
Basic Idea
The regression discontinuity design exploits a jump or discontinuity in the likelihood of being treated at some threshold point. In the RKD design, there is instead a change in slope at the likelihood of being treated at a kink point, resulting in a discontinuity in the first-derivative of the assignment function. These types of kinks arise in a number of government policies. For example, Simonsen et al. (2015) use a kink in the Danish government’s prescription drug reimbursement schedule: the subsidy is based on the total prescription costs the individual has paid during the year – there is 0% subsidy for the first 500 DKK in expenses, then 50% subsidy once you have paid 500 up until you have paid 1200, then 75% subsidy, and eventually an 80% subsidy for expenses above 2800 DKK. The result is that the share of the price paid out of pocket kinks as shown in Figure 1:
Figure 1: Y-axis is the share of the price paid out of pocket. It falls as one approaches 500 DKK since if you have spent 480 and buy something for 50, you get 0% subsidy on 20 DKK and then 50% subsidy on the 30 DKK that is expenditure past the threshold.
A second example is government unemployment insurance payments, which often cover up to some percentage of your previous wage, up to some maximum, and sometimes with a floor. For example, Figure 2, from a recent paper by Landais, shows the unemployment benefit in Louisiana as a function of the highest quarter earnings: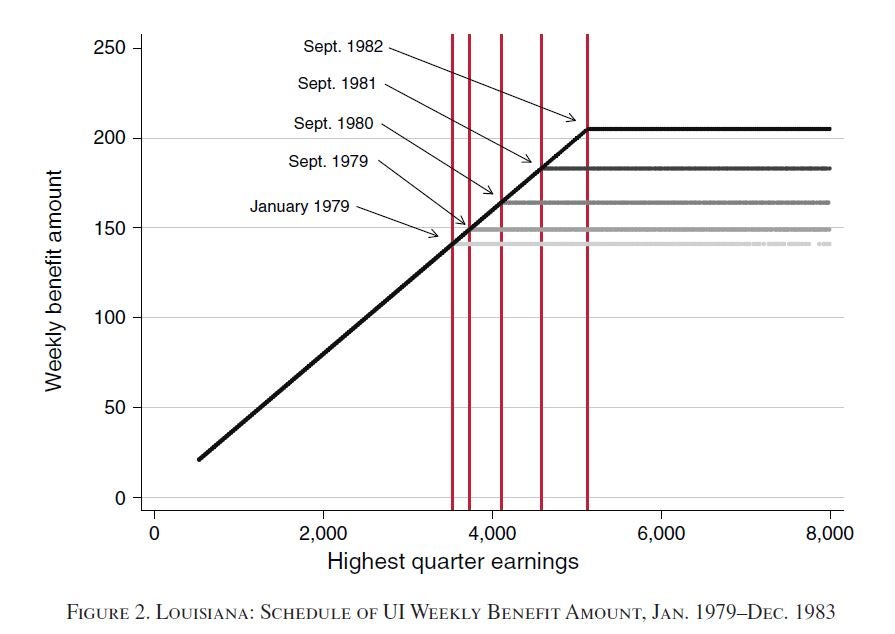
Then the idea is to see whether the outcome of interest also exhibits a kink/change of slope in its relation to the running variable at this same point. For example, Landais is interested in how long people spend in unemployment as function of the amount of benefit they receive. Figure 3 below shows a strong change in the shape of the relationship between unemployment duration and highest quarter earnings at this kink-point.
Figure 3: Kink in the outcome at the same place as kink in the treatment
Then the causal impact is found by dividing the change in slope for the outcome by the change in slope for the treatment.
When the policy rule is implemented with some error, a fuzzy RKD design can be used (see Card et al. (2015))
Estimation
This can be estimated by using a polynomial regression. Let x be the running variable (e.g. highest quarter previous earnings), Y the outcome variable (e.g. duration of unemployment); k the kink point, and D a dummy variable for being to the right of the kink. Then estimate:
Y = a0 + a1*(x-k) + b1*D*(x-k) + a2*(x-k)^2 + a3*D*(x-k)^2 + …
Then b1 tells you the change in the slope of the outcome at the kink point.
Then run the same regression to get the change in the slope of the treatment variable at the kink point of the running variable, and take the ratio of the two coefficients. The standard error can then be bootstrapped or recovered using the Delta method.
Estimation can also be done non-parametrically using local polynomials.
Key assumptions and checks
The key assumptions are similar to those for regression discontinuity and are checked in similar ways:


- There should be no change in slope at the kink point for other covariates (e.g. Landais shows no kinks in slope for age, education, capital income, or number of dependents at the kink point)
- There is no manipulation of the assignment variable at the kink point – e.g. in the unemployment case, people don’t strategically manipulate their past earnings in expectation of how this will affect their future unemployment benefits. This can be tested by McCrary-type tests that show the distribution of the assignment variable is continuous at the kink point, and also that the first derivative of this pdf is also smooth. Card et al. (2015) show that you can allow agents to do some sorting around the kink points, so long as they make small optimization errors or mistakes so that this sorting is not completely deterministic.
- This paper suggests some placebo tests you can do at non-kink points.
Caveats
- The RKD design can do pretty poorly in small samples, and typically will require a wider bandwidth or larger sample than you would need with a RDD.
- There are methods for optimally choosing the bandwidth, and papers that aren’t able to justify this choice and/or show robustness to different bandwidth choices face criticism. See the comments on this AEJ Economic Policy paper for an example.
Resources:
The AEJ paper of Landais has data and replication Stata code available online.
This Stata Journal article by Calonico et al. has some RD code that also covers the RKD case.

Join the Conversation