It’s been nearly 5 years since David McKenzie
showed us how to add standard error bars to Stata mean estimation comparing treatment and control groups. A recent reader email wrote to suggest that this how-to was due for an update, so here it is.
The request is for being able to graphically compare means of the different treatment groups in Stata, with the option to account for common regression adjustments including control variables, clustered standard errors, and strata fixed effects.
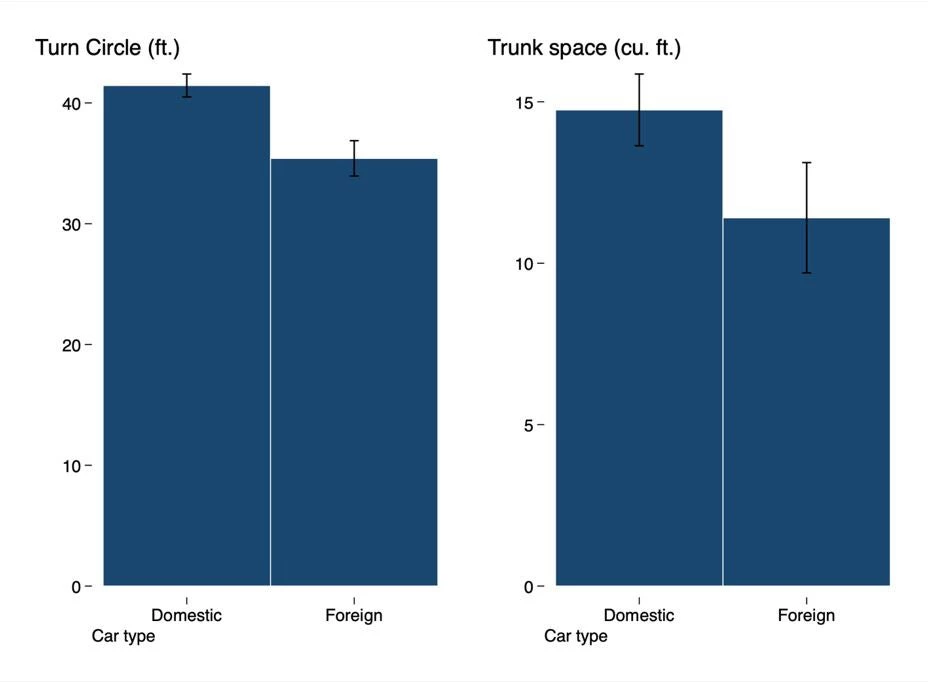
David forwarded me this email, and I whipped up a quick command that would use more modern Stata functionality – namely, the [margins] and [marginsplot] commands – to create versions of David’s original graphs that incorporated these requests: [ iemargins]. With a little styling, you should be able to use it to create adjusted comparison graphs like the following, which use Stata’s default auto data and consider the “treatment” of being a foreign car:
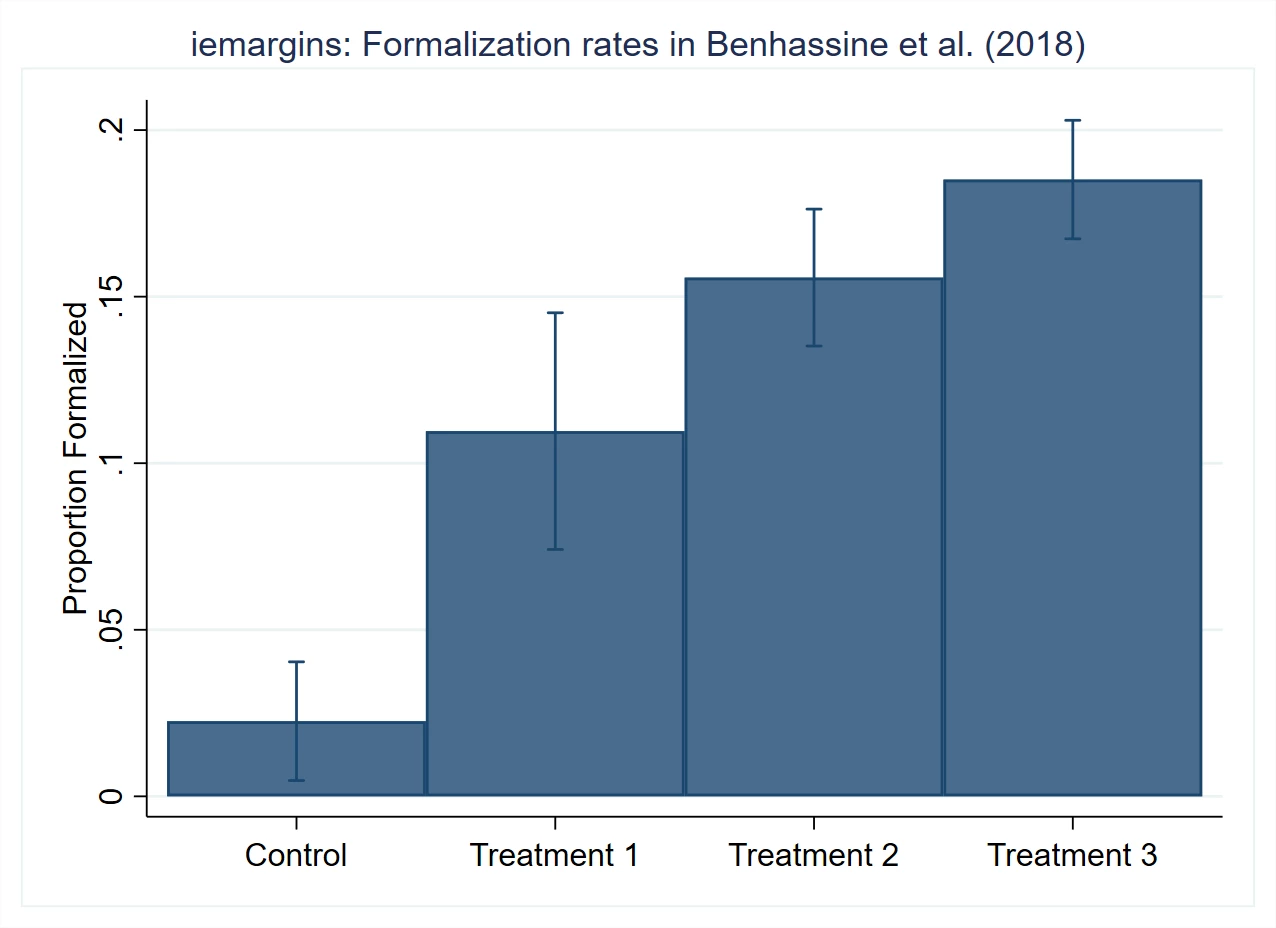
The command will allow for multiple treatments, so as another example, here are formalization rates by treatment status, after adjusting for randomization triplets, taken from column 1, table 3, from a formalization experiment in Benin, discussed previously on this blog.
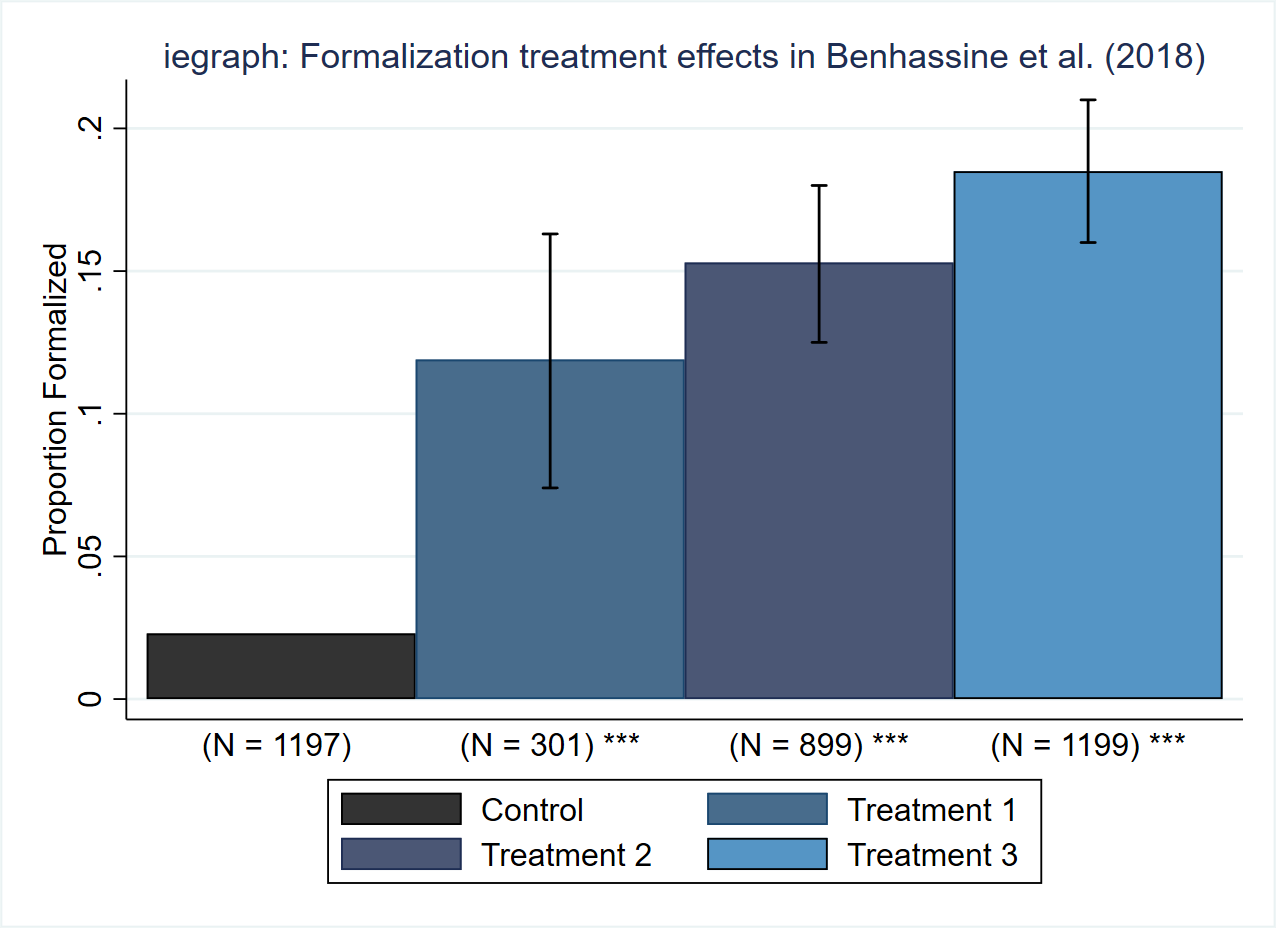
Note that the confidence intervals around each mean are those for the control- and strata-adjusted means of each group. This allows direct comparison of (adjusted) means of different treatment groups. This differs from David’s previous post, where they were based on confidence intervals for the difference between treatment and control, added to the means of the treatment groups. If you want to do that, a good option now is to use the iegraph command (part of the ietoolkit), which will prepare a graph like the following:
The iemargins command is not available on SSC yet, but has been posted to GitHub for a beta release so that the public can access it and request features and bug fixes. You can install it using [ net from https://github.com/bbdaniels/iemargins/raw/master/] and make development requests here.
To use the command, all that is required is a list of dependent variables, the name of the treatment variable, and the rest is done by options. The above graph is created by the following code:
iemargins turn trunk , treatment(foreign) ///
controls(headroom) ///
graph( title(, justification(left) color(black) span pos(11)) ///
graphregion(color(white) lc(white) lw(med)) bgcolor(white) ///
ylab(,angle(0) nogrid) xtit(,placement(left) justification(left)) ///
yscale(noline) xscale(noline) legend(region(lc(none) fc(none))) ///
plotopts(lc(white) lw(thin) la(center) fi(100)) ciopts(lc(black)))
In the background, the command is doing nothing more than looping over the dependent variables, running a linear regression using your treatment variable as an indicator variable with the controls included in the regression (it should be value-labeled), and using [margins] to calculate the predicted levels of the outcomes for the various groups. [marginsplot] creates the graphs, and [graph combine] puts them into the final image.
[iemargins] supports common subsetting and adjustment options, including regression options like clustering and bootstrapping; factor variables like strata as controls; adjustments to the confidence level; and forced axis alignment. Additionally, the controls() are optional: therefore it can also be used to visualize unconditional means with error bars in a very straightforward syntax with full styling options. Please have a look at the command on GitHub and suggest feedback or report errors, and I will hope to release it on SSC in the not-too-distant future!
The request is for being able to graphically compare means of the different treatment groups in Stata, with the option to account for common regression adjustments including control variables, clustered standard errors, and strata fixed effects.
David forwarded me this email, and I whipped up a quick command that would use more modern Stata functionality – namely, the [margins] and [marginsplot] commands – to create versions of David’s original graphs that incorporated these requests: [ iemargins]. With a little styling, you should be able to use it to create adjusted comparison graphs like the following, which use Stata’s default auto data and consider the “treatment” of being a foreign car:
The command will allow for multiple treatments, so as another example, here are formalization rates by treatment status, after adjusting for randomization triplets, taken from column 1, table 3, from a formalization experiment in Benin, discussed previously on this blog.
Note that the confidence intervals around each mean are those for the control- and strata-adjusted means of each group. This allows direct comparison of (adjusted) means of different treatment groups. This differs from David’s previous post, where they were based on confidence intervals for the difference between treatment and control, added to the means of the treatment groups. If you want to do that, a good option now is to use the iegraph command (part of the ietoolkit), which will prepare a graph like the following:
The iemargins command is not available on SSC yet, but has been posted to GitHub for a beta release so that the public can access it and request features and bug fixes. You can install it using [ net from https://github.com/bbdaniels/iemargins/raw/master/] and make development requests here.
To use the command, all that is required is a list of dependent variables, the name of the treatment variable, and the rest is done by options. The above graph is created by the following code:
iemargins turn trunk , treatment(foreign) ///
controls(headroom) ///
graph( title(, justification(left) color(black) span pos(11)) ///
graphregion(color(white) lc(white) lw(med)) bgcolor(white) ///
ylab(,angle(0) nogrid) xtit(,placement(left) justification(left)) ///
yscale(noline) xscale(noline) legend(region(lc(none) fc(none))) ///
plotopts(lc(white) lw(thin) la(center) fi(100)) ciopts(lc(black)))
In the background, the command is doing nothing more than looping over the dependent variables, running a linear regression using your treatment variable as an indicator variable with the controls included in the regression (it should be value-labeled), and using [margins] to calculate the predicted levels of the outcomes for the various groups. [marginsplot] creates the graphs, and [graph combine] puts them into the final image.
[iemargins] supports common subsetting and adjustment options, including regression options like clustering and bootstrapping; factor variables like strata as controls; adjustments to the confidence level; and forced axis alignment. Additionally, the controls() are optional: therefore it can also be used to visualize unconditional means with error bars in a very straightforward syntax with full styling options. Please have a look at the command on GitHub and suggest feedback or report errors, and I will hope to release it on SSC in the not-too-distant future!

Join the Conversation