Published on Data Blog

Can modern technologies facilitate spatial and temporal price analysis?

This page in:

The International Comparison Program (ICP) team in the World Bank Development Data Group commissioned a pilot data collection study utilizing modern information and communication technologies in 15 countries―Argentina, Bangladesh, Brazil, Cambodia, Colombia, Ghana, Indonesia, Kenya, Malawi, Nigeria, Peru, Philippines, South Africa, Venezuela and Vietnam―from December 2015 to August 2016.

The main aim of the pilot was to study the feasibility of a crowdsourced price data collection approach for a variety of spatial and temporal price studies and other applications. The anticipated benefits of the approach were the openness, accessibility, level of granularity, and timeliness of the collected data and related metadata; traits rarely true for datasets typically available to policymakers and researchers.

The data was collected through a privately-operated network of paid on-the-ground contributors that had access to a smartphone and a data collection application designed for the pilot. Price collection tasks and related guidance were pushed through the application to specific geographical locations. The contributors carried out the requested collection tasks and submitted price data and related metadata using the application. The contributors were subsequently compensated based on the task location and degree of difficulty.

The collected price data covers 162 tightly specified items for a variety of household goods and services, including food and non-alcoholic beverages; alcoholic beverages and tobacco; clothing and footwear; housing, water, electricity, gas and other fuels; furnishings, household equipment and routine household maintenance; health; transport; communication; recreation and culture; education; restaurants and hotels; and miscellaneous goods and services. The use of common item specifications aimed at ensuring the quality, as well as intra- and inter-country comparability, of the collected data.

In total, as many as 1,262,458 price observations―ranging from 196,188 observations for Brazil to 14,102 observations for Cambodia―were collected during the pilot. The figure below shows the cumulative number of collected price observations and outlets covered per each pilot country and month (mouse over the dashboard for additional details).

Figure 1: Cumulative number of price observations collected during the pilot

The granularity of the collected data allows for intra-country, or sub-national, analysis. The figure below presents the availability of price observations at state or municipality level for each pilot country (mouse over the dashboard for additional details).

Figure 2: Total number of price observations collected during the pilot

The price data collected through the pilot are accompanied by a rich set of metadata―including Global Positioning System (GPS) coordinates and related geographical designations, time-stamps, volume and weight details, and brand and model information―allowing for detailed localized and temporal analysis.

The example below shows the collected individual price observations for Rio de Janeiro, Brazil, mapped based on the longitude and latitude coordinates of each collected observation.

Figure 3: Locations of collected price observations in Rio de Janeiro, Brazil
Image
This map was produced by Staff of the World Bank. The boundaries, colors, denominations and any other information shown on this map do not imply, on the part of The World Bank Group, any judgment on the legal status of any territory, or any endorsement or acceptance of such boundaries.

Potential applications of the collected data include spatial inter-country and sub-national price studies, as well as temporal price analysis, such as the ones shown below.

The first map below shows the price levels for the “food and non-alcoholic beverages” category, estimated based on the data collected for the five pilot countries in Africa.

Figure 4: Price level indices (PLIs), number of priced items and number of price observations for the pilot countries in Africa

Image
This map was produced by Staff of the World Bank. The boundaries, colors, denominations and any other information shown on this map do not imply, on the part of The World Bank Group, any judgment on the legal status of any territory, or any endorsement or acceptance of such boundaries.

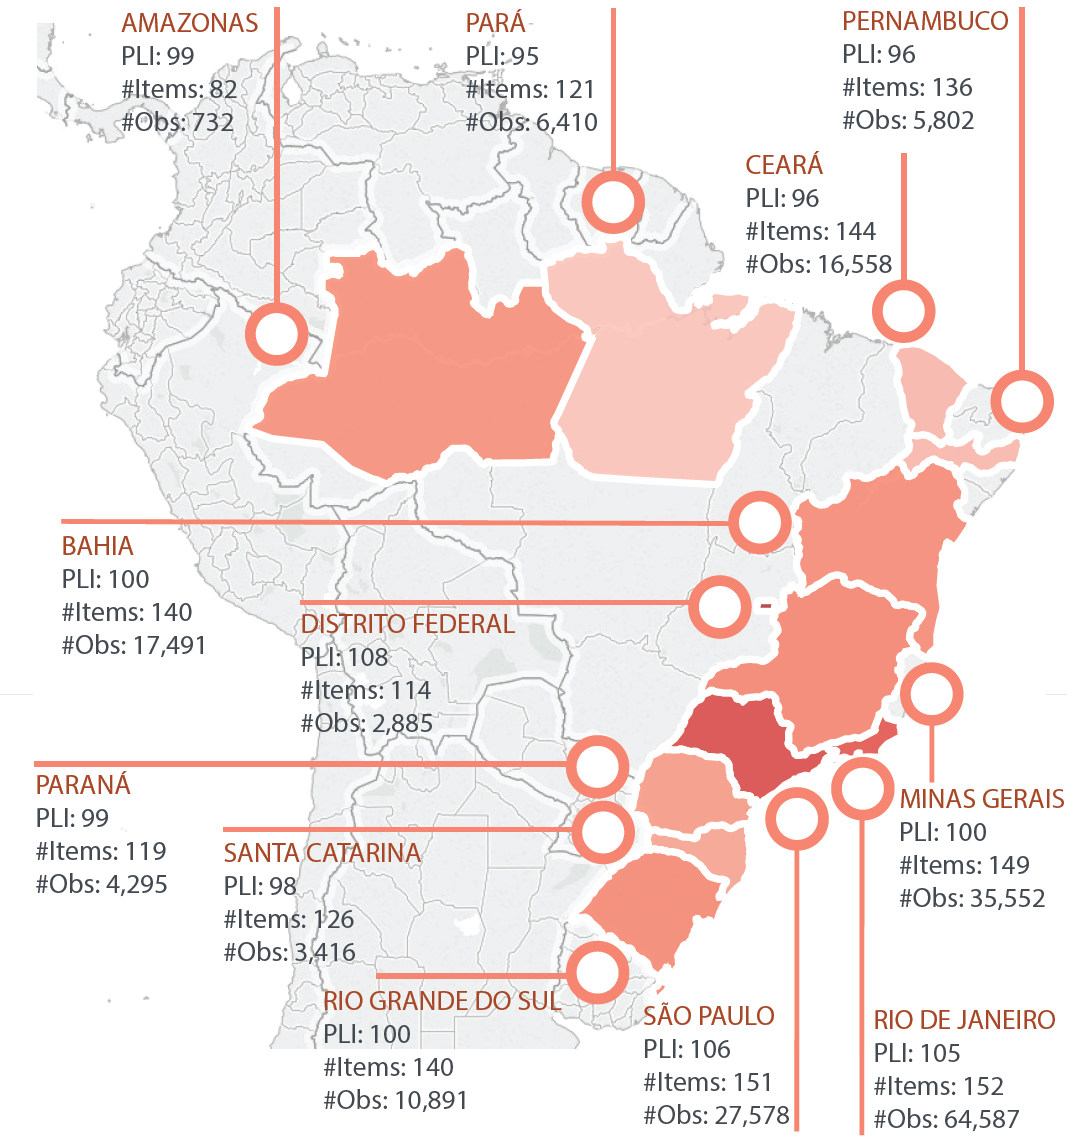
The second map below shows the price levels for the “household consumption” category, estimated based on the data collected for the twelve pilot states within Brazil.

Figure 5: Price level indices (PLIs), number of priced items and number of price observations for the pilot states in Brazil
Image
This map was produced by Staff of the World Bank. The boundaries, colors, denominations and any other information shown on this map do not imply, on the part of The World Bank Group, any judgment on the legal status of any territory, or any endorsement or acceptance of such boundaries.

Lastly, the figure below shows the monthly average prices, number of collected price observations and coefficients of variation (CV) for selected items in Brazil.

Figure 6: Monthly average prices (Brazilian Real), number of observations and CVs for selected items in Brazil
Image

A few key findings and lessons learned from the pilot follow below.

The currently available technologies allow for leveraging on a crowdsourced data collection approach. Certain aspects, such as the accuracy of the GPS coordinates, tend to vary based on the mobile phone used; however, these technological challenges are not a major issue. In addition, building a network of contributors is possible in most countries. The cost of owning and operating a smartphone has dropped significantly, extending the potential contributor base further and, hence, reducing possible contributor-group bias.

The achieved survey coverage tends to vary from a country or region to another; typically, countries or regions with a better network coverage (either wireless or broadband) and denser contributor networks tend to provide better results. In addition, ease of making micropayments to contributors plays a key role in achieving a wider coverage. The legality of conducting this approach in some countries can also pose challenges, as national officials can perceive alternative data sources as a risk.

The quality of the collected data depends highly on the user-friendliness of the data collection application and clarity of the item definitions. Albeit fraud is obviously possible, monitoring contributor behavior and analyzing accompanying metadata makes fraud detection and flagging relatively easy. Optimizing the collection approach and application to avoid fraudulent data points and oversaturated sample sizes for a given item or geographical area are crucial.

The sustainability of the approach depends mainly on the user base and efficiency of collecting data. If data needs and funding resources are pooled together, the price per data point and per user would lower significantly. Furthermore, the private firm operating the network of contributors has to be dedicated and reliable for sustaining such task in the medium to long term.

On the positive side, crowdsourced datasets can be made fully open and accessible to all users in a timely manner. All collected granular data with GPS coordinates and metadata have been released via the Development Data Hub, available here.

Let us know your thoughts and queries on the approach and use-scenarios of the collected data via the comment section below or by sending an email at icp@worldbank.org. We are thrilled to hear your views!


Join the Conversation

The content of this field is kept private and will not be shown publicly
Remaining characters: 1000
bjv
"from a set of problems that in retrospect could often have been controlled and may seem obvious to an outside party" This sounds just like about every software development project I have ever worked on. In 30 years, I have never worked on a project where one could not say "You know, if you pretend you are an outside 'consultant' and you reviewed this project you would have to say 'This is exactly how all the literature says you are NOT supposed to do it!'" But, of course, the immediate response is always a set of rationalizations about how this project is different.... Fortunately, in a couple of projects, I have been able to push through changes and found, to my surprise, that doing things "correctly" actually works pretty well in practice as opposed to theory. For years I was never sure whether doing things the "right way" actually worked, as I had never witnessed it first hand nor extensively debriefed anybody who had done the right thing (and was not simply a "consultant" selling something). You might find the book To Engineer is Human (by Henry Petroski) to be interesting. It discusses how helpful it is to catalog failures, positing that it is only through failure we can expand our fields of knowledge.

"from a set of problems that in retrospect could often have been controlled and may seem obvious to an outside party" This sounds just like about every software development project I have ever worked on. In 30 years, I have never worked on a project where one could not say "You know, if you pretend you are an outside 'consultant' and you reviewed this project you would have to say 'This is exactly...

Read more
Adam McCarty
I have been running a private ODA consulting firm out of Hanoi, Vietnam, since 2001. We have 24 staff in Hanoi, and another eight in our Yangon office. I have been working as an Economist in development for 30+ years. This is all leading to explain why I have seen and been involved in literally dozens of research project failures over the years (and many more if we include qualitative research, which the academic development community seems to have forgotten about nowadays). Here are some generic lessons from my experience: 1. At some stage to “many multiples” must rule out a quantitative approach. The DFID-funded BRACED in an example. At first glance it is a uniform project across hundreds of villages to “strengthen resilience”, but dig and it is clearly not: there are three implementing INGOs, each does different sets of interventions in their specific geographic areas, with differences in activities and timing of inputs with each INGO. This dog’s breakfast of implementation happened “as there were many delays” so an evaluation-friendly model never developed. Given that, no surveys should have been done, but they could not be abandoned because “they are in the work plan” – and there is no formal step that critically reviews the relevance of pending activities. 2. With very few exceptions every INGO-led quantitative evaluation is a waste of money. Bank and other academics do not understand this problem. Their gaze is only upon large-scale surveys, good and bad. Yet for every one of those there are dozens done by INGOs who are “ticking a box” required by those who give them money. Typically small projects, and using some illogical rule of thumb like “3% of total budget should be for M&E”, they use the M&E pittance to survey maybe 300 households. As nobody cares about the results (implementer or funder), all the usual problems are exacerbated: a baseline survey implemented long after the interventions started; poor sample selection; rushed implementation; shoddy analysis; etc. 3. Unpacking incentive structures is the path to understand why nobody cares about results. I exaggerate, of course. Poor Economics, Gates, and other “big project” people do care and add value through gold standard rigorous work. But that is maybe 1% of all projects. Most others involve organisations and people who have no incentive to take results seriously. All organisations involved in the “value sucking chain” are constantly having to defend their budgets. Personal careers depend on what was implemented, not results. The prestige of organisations depends on how big they are. Work through the incentives story and you understand why results (and failures) are not just irrelevant – they are positively discouraged. But it also leads you to consider solutions. Here is one: An INGO implements a project for $2m and is paid in full upon completion. Two years later a post-evaluation is done and based on that the INGO will get a bonus of up to 30% of the original project value based on measured sustained results. That bonus they can spend on any projects they wish to develop without (the usual) micromanagement by the funder. Catch: the post-evaluation is a public report. The development sector suffers dreadfully from a trivial approach to understanding incentive structures. Thus we are caught in an endless cycle of agreeing on “the best thing to do” but never doing it: evaluations; tied aid; information sharing; cooperation; sharing failures; bla bla bla. Healthy cynicism is needed – directed into incentives research, leading to innovative solutions.

I have been running a private ODA consulting firm out of Hanoi, Vietnam, since 2001. We have 24 staff in Hanoi, and another eight in our Yangon office. I have been working as an Economist in development for 30+ years. This is all leading to explain why I have seen and been involved in literally dozens of research project failures over the years (and many more if we include qualitative research, which...

Read more