
Soon after experiencing our first pandemic lockdowns last year, we saw visualizations documenting how people’s movement changed around the world. Those descriptions of mobility came from apps installed on many of our smartphones.
Practitioners use mobility data to test the effectiveness of lockdowns and identify transmission hotspots. One catch is that most mobility analysis seen this past year tracks the movement of smartphones, not people. In a new study, we show that this can be a pretty important catch in low-income countries where few people have smartphones. We find that in Uganda, smartphone mobility estimates may differ by as much as 40% from estimates that track the basic mobile phones that are more common.
Smartphone usage has been increasing substantially in recent years, yet in sub-Saharan Africa, there are only 33 mobile internet subscriptions per 100 people.
We focus on Uganda, which has similar penetration rates for mobile phones (57 per 100 people) and smartphones (34 per 100 people) as other countries in sub-Saharan Africa based on ITU statistics. We find that smartphone owners are wealthier and more educated than those with basic/feature phones. They are also more likely to live in denser urban areas (Figure 1). This raises an important question: do these smartphones give us a good sense of how the general population moves?
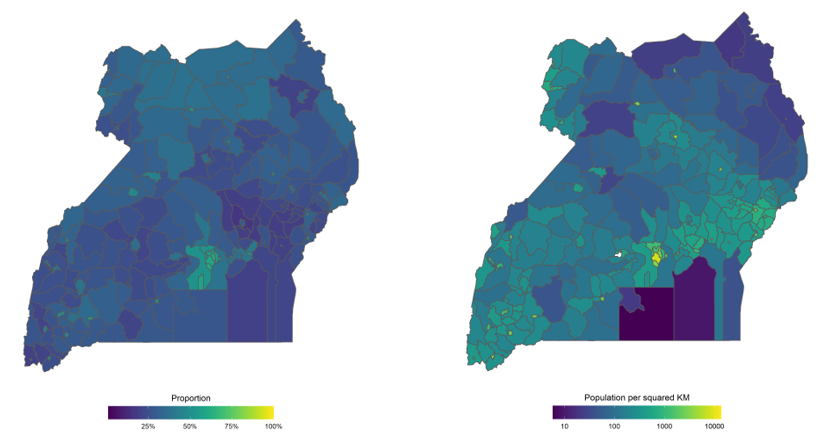
Smartphones (left, proportion of one mobile network operator’s subscribers that use data) are clustered in the counties with highest population density (right, 2014 census)
We explore this question using anonymous data derived from cell phones known as call detail records (CDR) from a major operator in Uganda, which includes both smartphones and basic mobile phones.[1]By using a dataset that has both types of users, we can explore whether people with smartphones (captured in smartphone mobility estimates) move differently from those with basic phones (omitted from these common measures). Additionally, the shock caused by COVID-19 restrictions provides an opportunity to observe whether they react differently to new policies.
Overall, travel patterns are similar between the two groups: movement between counties is clustered within regions, and there are many trips in and out of Kampala. Yet there are important differences: trips to the capital account for 10% of smartphone users' trips but only 4% of basic phone users' trips. Smartphone users are also much less likely to travel within the Eastern region.

In February 2020, the movement of smartphone users (left) was similar to basic phone users (center), with some diferences (right, average difference) [Origin/Destination Matrices]
But once lockdowns hit, smartphones reduce their travel by at least 40% more than basic phones. That is consistent with evidence in other places that the rich were more likely to stay at home. If we just looked at smartphone data, we would be mistaken into thinking lockdown policies had a larger effect than they did.
Smartphones reduce mobility more than basic phones in response to a lockdown (daily trips per person as a percent of baseline average)

There are important caveats to using these types of data to measure mobility. First, even though our estimates capture more than just smartphones, we are still not able to capture those that do not own a phone at all. Second, digital devices only capture a person’s location at particular times: for CDR only when people make calls/texts or use the internet, and for smartphones when certain apps are installed and location services are on. If two people have the same number of trips, but one of them uses their phone more, she could appear to be moving more because there is a higher probability of capturing her in different locations. We sample location observations to try to make this bias comparable for smartphones and basic phones. This strategy is not perfect—it raises additional questions that we explore in the paper—but it’s a start.
Policymakers should consider that digital mobility data may not be representative of entire populations. We are still learning the shape of these biases, and how they vary between contexts. Even in countries with high penetration of smartphones, smartphone mobility data can undercount elderly and nonwhite populations.
In communities where smartphone adoption is still low, one option is to work with internal data from mobile phone operators like we did, which may cover more of the population. Yet, cellphone towers provide far less precision than GPS data, particularly in rural areas where towers can be sparsely placed. Additionally, they can raise important privacy concerns and can be quite difficult to obtain.
Acknowledgments:
The research has been possible thanks to UK aid from the UK government through the i2i and ieConnect for Impact programs; support from the Trust Fund for Statistical Capacity Building III (TFSCB-III), which is funded by the United Kingdom’s Foreign, Commonwealth & Development Office, the Department of Foreign Affairs and Trade of Ireland, and the Governments of Canada and Korea; as well as support from the Research Support Budget in the Development Economics Vice-Presidency.
[1] Since we do not have information on the phone model used in the dataset provided, we define smartphone users as those that have on average at least one data observation per day in either February, March or April (meaning at minimum around 30 observations in one of those months) and basic phone users refers to all other users in the dataset.


Join the Conversation