
In the policy arena, the debate on the impact of infrastructure investments on resilient and inclusive growth has flared up as the world economy attempts to recover from the COVID-19 pandemic. Yet, several important questions remain to be addressed. What is the most efficient way to extend access in various infrastructure sectors? Does the initial level of development of a country matter? What is the “true” impact of infrastructure investments on various development outcome categories including, inter alia, output and productivity, poverty and inequality, labor market outcomes, human capital formation, and trade?
To provide a solid answer to these questions a new study from the World Bank Infrastructure Chief Economist’s Office, “The Impact of Infrastructure on Development Outcomes: A Meta-Analysis,” conducted a meta-analysis of the infrastructure research done since the 1980s in the transport, energy, and digital sectors.
Why a new meta-analysis?
There have been a handful number of studies using meta-analysis to estimate the “true” impact of infrastructure, mostly focused on developed countries, relying on a broad definition of infrastructure measured through cross-sectoral, public capital figures, and production function models. Most of them do not include more recent papers, which mostly use more granular data and cutting-edge identification strategies.
To fill this gap, we created a database including almost a thousand estimates that report elasticities from 201 papers for the period 1983 and 2022. To our knowledge, this is also the first study exploring the impact of three sub-sectors of infrastructure: energy, digital, and transport.
Is there a publication bias?
Traditional meta-analyses often produce a funnel plot showing the distribution of effect size estimates plotted with their precision. Because a measure of the variability of each estimate (1/SE) is placed on the vertical axis, those estimates at the bottom have larger standard errors and are, therefore, more widely dispersed. In contrast, the more precise estimates (i.e., those at the top) will be more compactly distributed.
Although the plot of development outcome elasticities is roughly funnel-shaped, the right-hand side has more points and there is evidence of bunching above the statistical significance lines, indicating a high prevalence of studies with results just above the 5 percent significance level. This is a common finding across many topics in economics, and points to systematic positive publication bias in the infrastructure literature, which our regression results confirm. Quantifying publication bias and controlling for it is important, as it then allows us to generate estimates of “true” underlying effects.
Figure 1: Funnel Plot
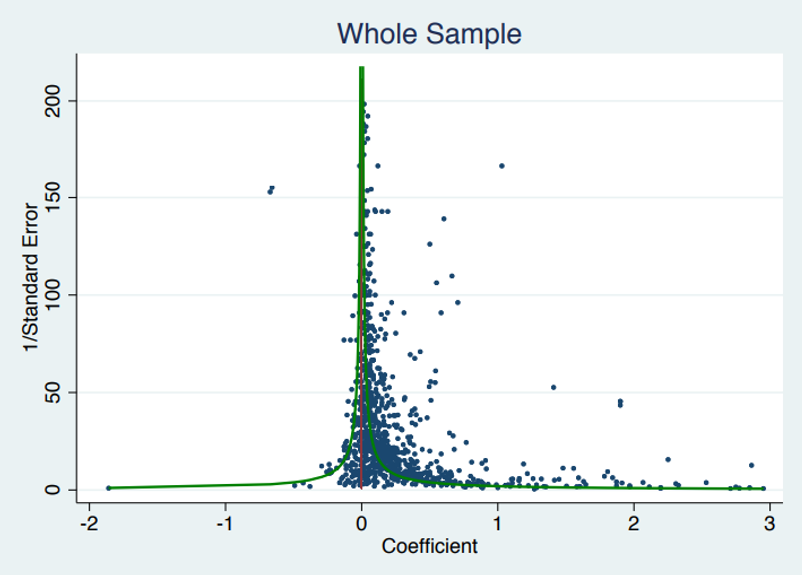
Source: Authors’ elaboration
How big is the “true” effect?
The size of the effect depends crucially on the way infrastructure is defined. Moving from the initial focus on cross-sectoral studies to specific infrastructure sectors, the estimates become relatively small. Notably, from an initial value equal to 0.16 for public capital, the estimated elasticities for the individual sectors range between 0 and 0.06.
Encouragingly, the developmental impact of infrastructure is higher for developing countries, at least in the digital and transport sectors. Plotting the main effect from precision-effect estimate with standard error (PEESE) estimations focusing only on developing countries’ observations, a few differences are visible. First, the meta-analysis estimates are much larger for digital studies focusing on developing countries, with point estimates at 0.085 for micro output and 0.07 for macro output. Second, developing countries’ meta-estimates are similarly larger for transport macro output (0.06 vs. 0.05).
Figure 2: PEESE Estimates by the level of development

Source: Authors’ elaboration
The developmental impact of infrastructure is also higher in rural areas, at least in the transport sector. Most notably, the average impact for rural roads is almost three times the one for the overall road subsector.
Can we leverage these estimates to produce marginal rates of return for specific sector outcomes?
These numbers provide useful indications on how different development outcomes are potentially impacted by infrastructure interventions. Deciding on which policies or sectors to prioritize would additionally require that we translate these elasticities into specific rates of return.
Given the differences in the nature of infrastructure indicators used and in the scale of underlying investments, lower elasticities do not necessarily entail smaller impacts or lower rates of return. In a broad production function framework, the marginal rate of return can be computed as the product of the elasticity and the ratio of GDP to the corresponding infrastructure stocks. This requires updated infrastructure capital stock figures for each of the dimensions covered in the meta-analysis. We are developing such indicators and exploring the question in subsequent ongoing work.
________________


Join the Conversation