
According to data published by the European Union’s climate change service Copernicus, this past 2023 was the hottest year ever recorded in human history with June being the warmest month—overtaking by far the record registered in 2016.
No one could argue against the importance of tracking temperature increases in order to measure how fast (and intensely) our planet is warming. But, how is the world monitoring those elements making our planet hotter and hotter? How are countries—and the international community—confidently tracking the world’s greenhouse gas emissions (GHG)?
The lack of accurate and consistent carbon dioxide (CO₂) and methane (CH4) emissions data has hindered the efforts to rapidly reduce emissions. Recognizing the urgent need for a comprehensive and reliable GHG monitoring scheme, a multi-disciplinary team at the World Bank launched an initiative to leverage advancements in satellite based GHG measurements to fill the global information gap.
“In recent years, the satellite-based GHG emission measurements have emerged as potentially a game-changing solution, offering independent, objective, and international data collection,” says Dr. Susmita Dasgupta, Lead Environmental Economist with the World Bank’s Development Research Group and project coordinator.
To make the complex satellite data useful for policymaking, the team developed a robust and transparent data framework to set baselines and tools to monitor changes worldwide. This enormous undertaking resulted in the creation of two global CO₂ and three global CH4 databases containing data that are comparable across space and time from NASA’s (National Aeronautics and Space Administration) Orbiting Carbon Observatory-2 (OCO-2) and ESA’s (European Space Agency) TROPOMI.
Measuring carbon dioxide levels
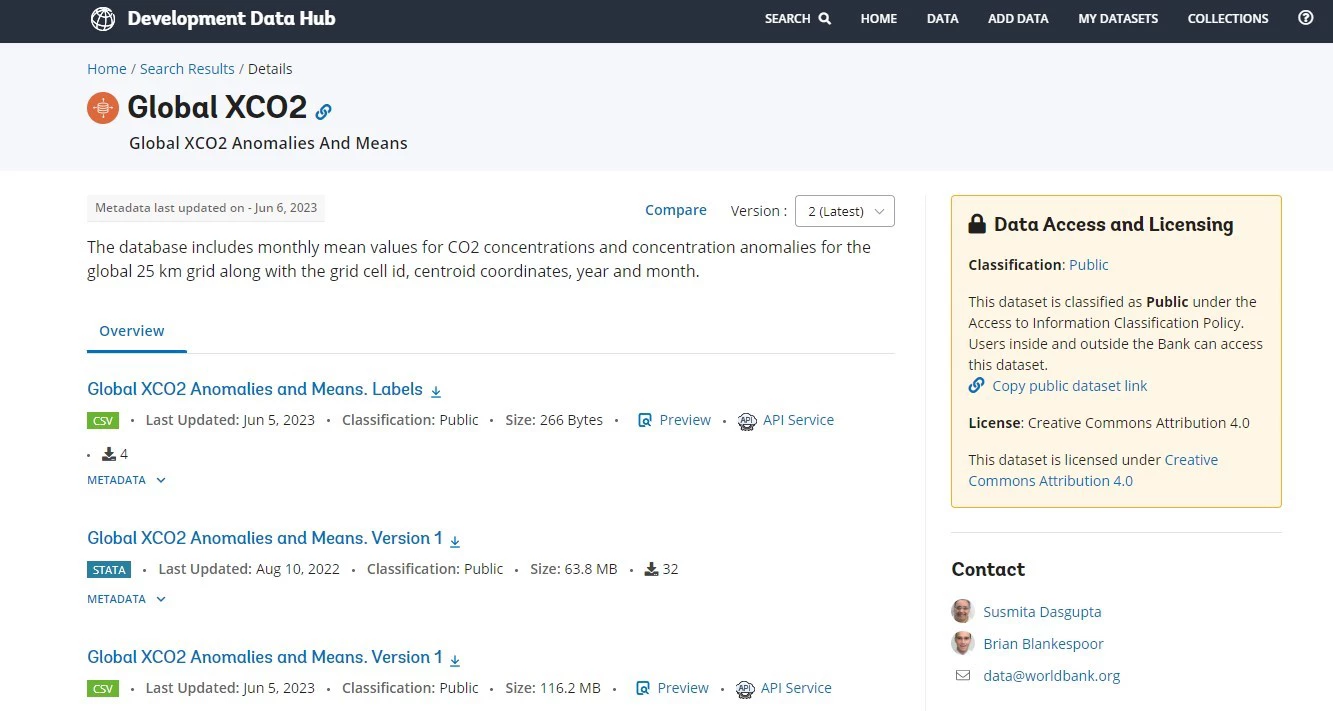
The first database focuses on global CO₂ anomalies and mean values. The database provides a comprehensive understanding of CO₂ emissions worldwide over the past decade that is mapped across a 25-kilometer global grid. The data allows teams across the World Bank, as well as researchers and policymakers around the world to assess long-term trends and short-term variations in CO₂ emissions. The X below represents that the observation took place from a satellite.
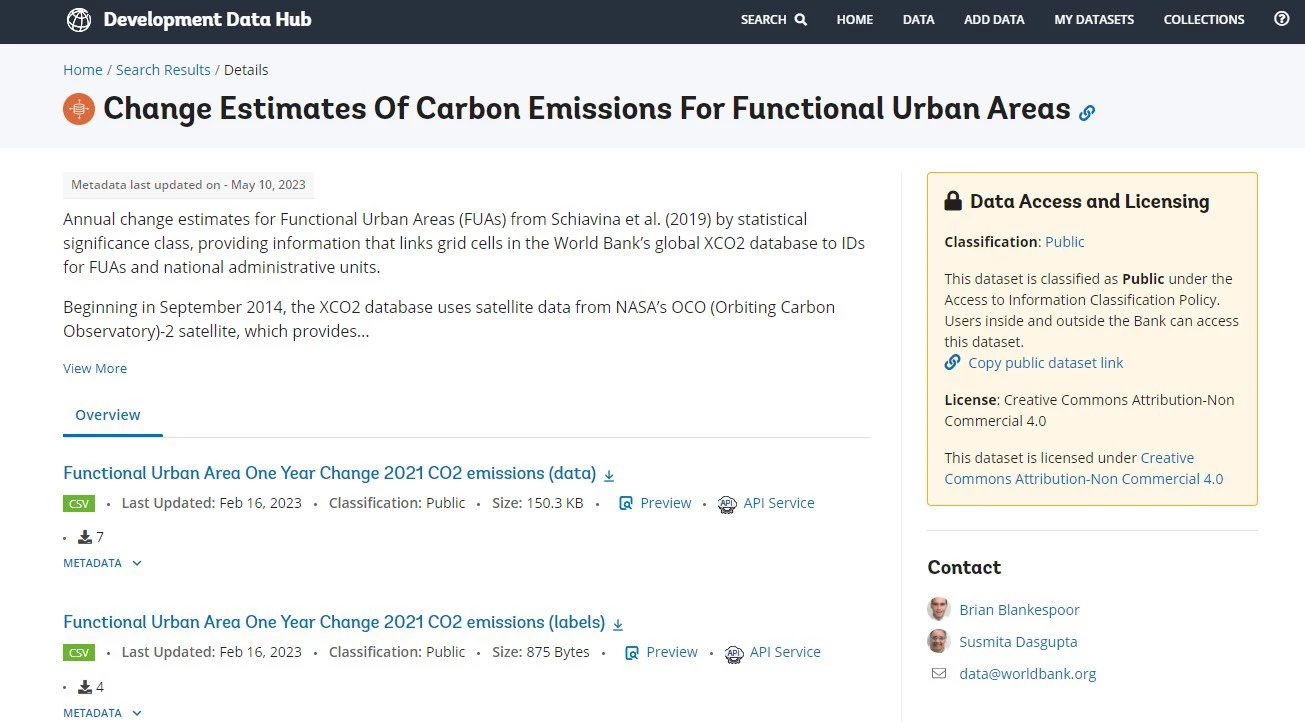
Urban areas account for over 70% of global CO₂ emissions, yet very few, primarily in developed countries, have access to consistently monitored CO₂ emission data. To address this gap, the team utilized multi-year CO₂ estimates from NASA’s OCO-2 to monitor 1,799 urban areas with populations exceeding 500,000 inhabitants.
To present this data, the second database was set up, summarizing changes in CO₂ specifically within functional urban areas (densely inhabited cities plus less densely populated zones with populations that are highly integrated with the cities). The goal here is to offer valuable insights into CO₂ emission sources and patterns in the biggest urban areas around the world.
Analyzing methane data
The team also looked at ways to analyze methane emissions. ESA's TROPOMI satellite data has been instrumental in identifying methane “hot spots” by location and sector. This data can aid in establishing baselines and in tracking the progress of over 100 nations that have pledged to reduce methane emissions. To present this data, three databases were developed.
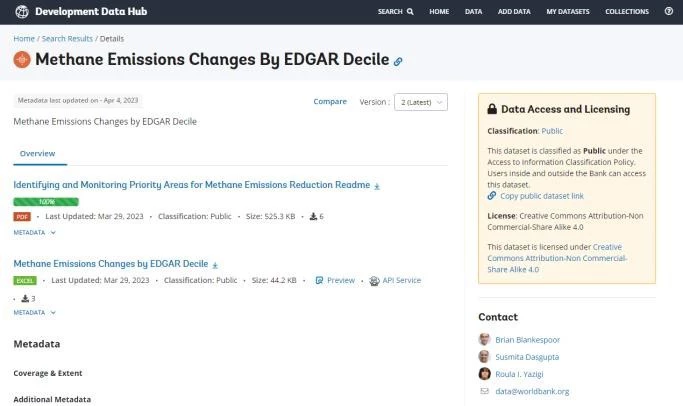
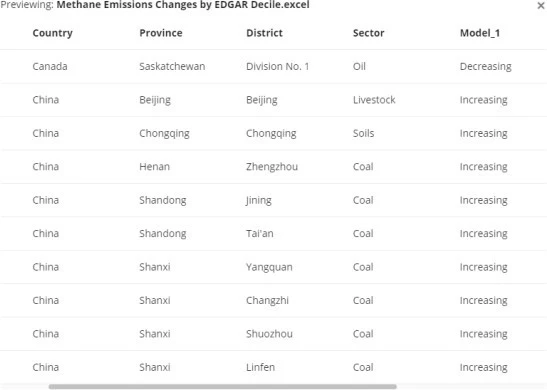
The first database involves satellite-derived data on anomalies and mean values in methane emissions worldwide at a 5 km global grid for the past five years. The second database summarizes CH4 changes within large urban areas. The third database identifies the location of the top 50% methane emitters and their sectors (agricultural soils, livestock, gas, oil, coal, landfills, and wastewater) along with changes in their emissions over time.
Open data, transformative data
The value of these databases lies in their versatility and accessibility—with their structure allowing for seamless integration of other geospatial data. They enable increasingly precise measurements—monthly changes in mean levels of emissions at nearly any point on the globe, for example, and provide useful estimates of how emissions are changing in large urban areas.
“By processing satellite readings, we were able to generate emission estimates that are comparable across space and time and make them open to anyone interested,” says Brian Blankespoor, Senior Geographer at the World Bank and a member of the team. “The data can be used to understand CO₂ and CH4 emission trends in urban areas across the world,” he says.
The World Bank’s pioneering efforts, in collaboration with NASA and ESA, can be transformative in the fight against climate change by providing a valuable input to designing effective strategies to curb GHG emissions paving the way for a more climate-friendly approach to urban planning and infrastructure development.
Related Links:
Global XCO2 Anomalies and Means
Change Estimates of Carbon Emissions for Functional Urban Areas Global XCH4 Anomalies and Means (5x5 Km)
Methane Emissions for Functional Urban Areas Methane Emissions Changes by EDGAR Decile
Reports:
Identifying and Monitoring Priority Areas for Methane Emissions Reduction Scalable Tracking of CO2 Emissions: A Global Analysis with Satellite Data


Join the Conversation