The conditions and circumstances of people across the world cannot be boiled down to only national averages. Within the same country, economic development can be unbalanced, with some regions benefiting from growth while others lag. Understanding these differences at a granular level is an essential part of monitoring welfare and knowing where to focus development efforts where they are most needed.
The World Bank’s new Geospatial Poverty Portal is an important tool in these efforts, providing subnational poverty, inequality, and multi-dimensional poverty indicators over time and at a global level. This new website is a part of the global poverty monitoring at the World Bank, which is featured in the Poverty and Inequality Platform (PIP).
The portal features an interactive map based on data from the newly released Subnational Poverty and Inequality Database (SPID), spanning over 1,600 subnational areas from 141 economies. Statistics in the SPID are direct calculations from available survey data at their levels of representativeness, meaning data frequency varies by country. Some countries have subnational time series as long as 10 years, allowing users to compare changes temporally and spatially over a long period.
The SPID shows that countries can have large variations in prosperity across subnational regions. Differences can be surprisingly wide in countries with large development divides between rural and urban centers. Remote areas are often still reliant on low productivity agriculture, but many of these countries also have dynamic and growing urban cores. For example, in the case of Thailand, the World Bank’s Upper-Middle Income country poverty rate ($6.85/day 2017 PPP) for Bangkok in 2020 is effectively 0 percent, while Mae Hong Son, the poorest province, has a poverty rate of 47.3 percent.
Figure 1. Interactive map based on the Subnational Poverty and Inequality Database
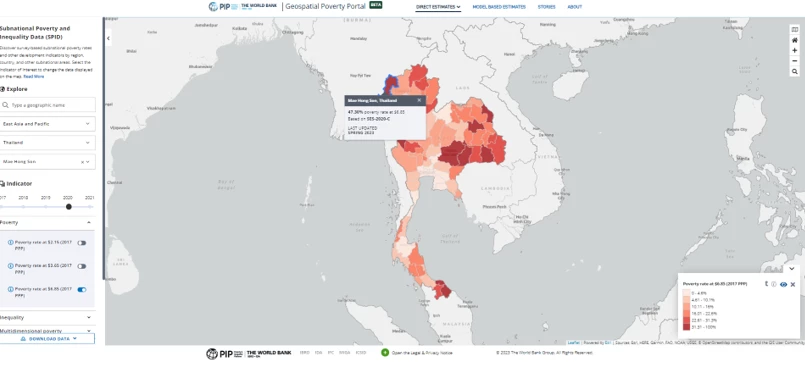
Source: SPID
The availability of survey data across countries varies. Some countries publish data annually, while others have large gaps between surveys. To compare subnational areas across countries, it is important to be able to compare them at the same point in time. This is done by “lining up” the poverty rates at the national level using the same methods used for global poverty monitoring and then zooming in on subnational poverty estimates.
The Global Subnational Atlas of Poverty (GSAP) is a map of line-up subnational poverty rates in over 1,700 areas across over 160 economies projected to a common year. The newest version of the GSAP features subnational poverty rates lined up to 2019. While only 12 countries have extreme line-up poverty rates higher than 50 percent in 2019, the GSAP shows that there are 182 subregions from 26 countries with poverty rates higher than 50 percent. Among these, 162 are in the Sub-Saharan Africa region, another 19 are in the Middle East and North Africa region, and one in East Asia and Pacific.
One way in which the GSAP has been used is to determine the number of poor that face the added challenge of living in locations with high climate risk or exposure to natural hazards. A 2022 article in Nature used the 2020 edition of the GSAP and found that as many as 1.8 billion people are directly exposed to one-in-100 year floods, and 780 million of them live below the World Bank’s Upper-Middle Income country poverty line.
Poor households have fewer coping mechanisms and safety nets, which make them more vulnerable in the presence of climate risks. Exposure to climate shocks can result in long-run welfare losses for their households. Figure 2 shows that there is variation in the patterns of subnational poverty rates (measured at the WB International poverty line) given different levels of flood risk (low, medium, or high) in selected countries. Subnational areas with high rates of poverty and number of poor are sometimes, but not always, areas with high natural hazard risk. Thus, it is important to understand the relationship between poverty and climate risk for different country contexts.
Figure 2. Exposure to flood risk in five Sub-Saharan countries by subnational region
A common challenge is that granular information is desired for climate vulnerability analysis, but poverty and other social statistics are not available at that level of detail. Even when census or household survey data is available, information may be too limited.
Small area estimation techniques offer some options to remedy this issue. The first technical research of small area estimation was in 1994 (Ghosh and Rao). Since, the World Bank helped to popularize and operationalize the use of small area estimation (sae) techniques through further research (see our previous blog) and the development of tools such as the PovMap software 15 years ago, and more recently open-source Stata sae code. Today, the Stata sae code is the World Bank’s gold standard of accurately estimating poverty at small areas.
These resources are featured on the Geospatial Poverty Portal together with a growing archive of historical poverty mapping work done by the World Bank and national statistical offices. This archive of small area estimation data will hopefully enable more spatial analysis and research on granular poverty and other spatial data. The Stories page also features innovative examples of work that illustrate a more granular story about poverty and vulnerability in a country. An example from Vietnam below shows the power of combining small area poverty estimates with climate and environment data (report).
Figure 3. District level small area poverty estimates in Vietnam, 2019
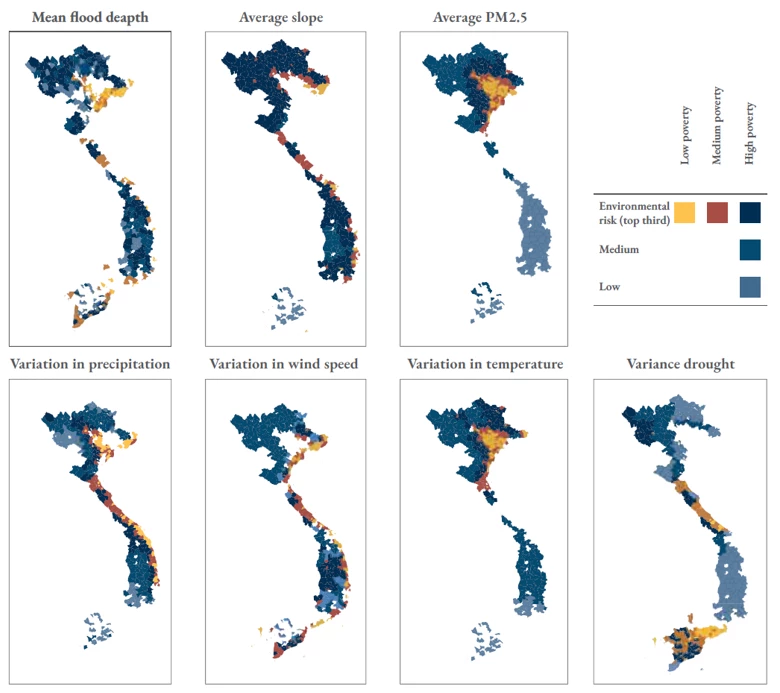
Source: Figure 6.7, https://www.worldbank.org/en/country/vietnam/publication/2022-vietnam002Dpoverty-and-equity-assessment-report
We are excited about the potential of geospatial data to tell a more nuanced and visually compelling story about how the most vulnerable in the world are impacted by changing climate patterns. More enhancements, additional features and data are planned for the Geospatial Poverty Portal.
If you would like to recommend your work to be featured in our Stories page, or to learn more about this initiative, please reach out to data4goals@worldbank.org or pip@worldbank.org.


Join the Conversation