The global poverty update from the World Bank published last month presents new global poverty estimates for 2017 and revises the previously published global and regional estimates for earlier years (for details see Castaneda et al., 2020, PovcalNet). The main change of this update is the adoption of the revised 2011 PPPs for the estimation of global poverty, which were released by the International Comparison Program in May 2020. Earlier work showed that the revised 2011 PPPs increase global poverty very slightly, but leave the historical trends virtually unchanged (Atamanov et al., 2020).
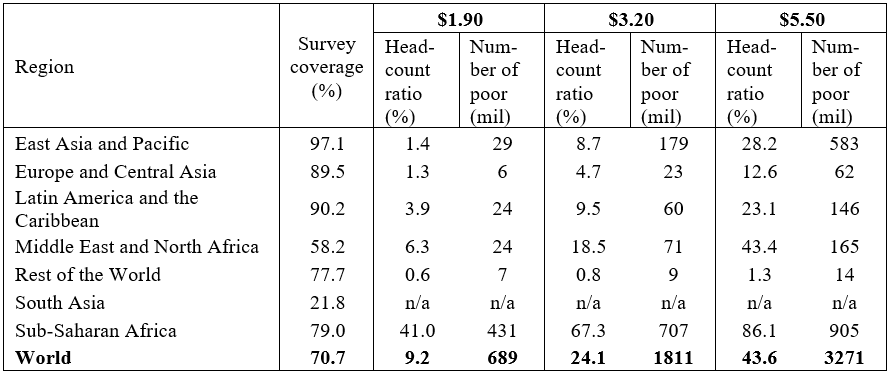
The poverty estimates from the September 2020 PovcalNet update are presented in Table 1 below. It is estimated that 9.2% of the world population (689 million people) lived below the International Poverty Line (IPL) in 2017. More than 60% of the world’s poorest people live in Sub-Saharan Africa, which at 41% has the highest regional poverty rate. Around a quarter of the world’s population (24.1%; 1,811 million people) live on less than $3.20/day, while almost half (43.6%; 3,271 million people) live on less than $5.50/day.
Table 1. Poverty estimates for reference year 2017, different poverty lines
Source: PovcalNet
Note: Survey coverage is based on percentage of population and is assessed within a three-year window either side of 2017, i.e. including surveys that were conducted between 2014 and 2020. The estimates for South Asia are not displayed since the region has a survey coverage less than 50% of the region’s total population.
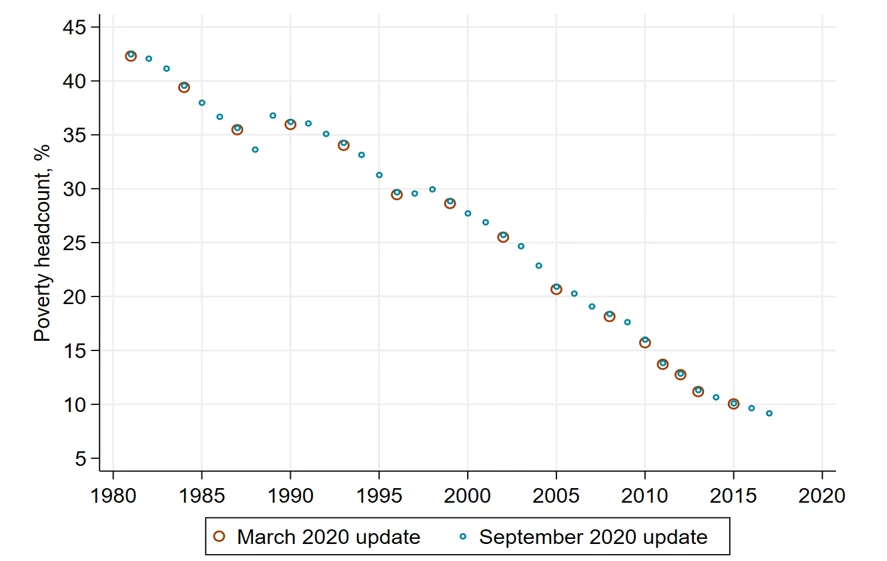
Poverty has reduced across the world, from 36.2% in 1990 to 9.2% in 2017 (Figure 1). Historically, progress has been seen in all regions, with the exception of the Middle East and North Africa, where poverty has been recently rising due to conflict and fragility. The Poverty and Shared Prosperity 2020 report published today provides a more detailed analysis of these poverty trends.
Compared to the March 2020 update, the September 2020 update results in small changes in the global poverty estimates (see Figure 1, regional series available here). Figure 1 compares the lined-up poverty estimates at the global level for the March 2020 and September 2020 updates. These differences are driven by the PPP revisions together with other changes documented in Castaneda et al. (2020), such as the adoption of new data on household consumption expenditure for Nigeria (2018/2019).
Figure 1. Global line-up estimates of extreme poverty
Source: PovcalNet, ICP
Note: Interactive graphs depicting lined-up estimates of extreme poverty at the global and regional level.
The revised 2011 PPPs not only affect the total count and regional profile of the poor, but in principle they also have the potential to alter the derivation of the poverty lines that the World Bank uses for global poverty measurement: The international poverty line (IPL) of $1.90 is based on the national poverty lines of some of the poorest countries in the world, converted to United States dollars using PPPs (Ravallion et al., 2009; Ferreira et al., 2016). The $3.20 and $5.50 lines are more typical of the national poverty lines found in lower-middle income and in upper-middle income countries, respectively (Jolliffe and Prydz, 2016). When we replicate the derivation of these lines with the revised 2011 PPPs, the estimates for the $1.90 and $3.20 lines do not change, while the $5.50 line increases by approximately $0.15 (Atamanov et al., 2020). The World Bank has decided to keep all the global poverty lines unchanged, including the $5.50 line. These poverty lines are goalposts to be held fixed over time and they have become widely used, so there is a cost to revising them frequently. The global poverty lines were chosen with the PPPs available at the time using a reasonable method; thereafter we view them as fixed parameters to monitor progress in different parts of the global distribution of income or consumption.
As shown in Figure 1, PovcalNet is now reporting annual line-up estimates of regional and global poverty. Previously, poverty estimates were reported at varying intervals. The introduction of annual line-up poverty numbers makes it easier to compare changes over time, as it standardizes the distance between line-up years instead of gaps of one, two, or three years. With the added annual granularity it is also possible to see that COVID-19 is likely to cause the first increase in global poverty since 1998, when the Asian Financial Crisis hit (see the updated estimates of the impact of COVID on global poverty here). This was not apparent from the line-up years available previously which included 1996 and 1999, but not the years in between (e.g., 1998).
Together with reporting annual line-up estimates, we have also slightly revised the coverage rule which governs whether global and regional poverty estimates are displayed (for more details, see Castaneda et al., 2020). It is important to stress that the reporting of annual line-ups and the revision of the coverage rule do not change the backend or methodology of PovcalNet, but merely whether an estimate is displayed or not. Under the new coverage rule, a poverty estimate is reported as long as there are survey data within three years either side of a line-up year covering at least 50% of the regional population. We have added an additional requirement for the global poverty estimate: it is only reported if at least 50% of the population in low-income and lower-middle income countries (LIC/LMIC) are covered (in addition to the 50% requirement applied to the world population). Most of the poor live in low-income and lower-middle income countries (e.g., in 2017 more than 93% of the global extreme poor), so this additional requirement ensures that the global poverty estimate is representative of the world’s poorest. With the new coverage rule, poverty estimates can be reported for all regions until 2018, except South Asia whose poverty estimate stops in 2014. The global poverty estimate stops in 2017.


Join the Conversation