Today, the World Bank is launching the Statistical Performance Indicators (SPI) – a new set of indicators to measure the performance of national statistical systems in 174 economies from 2016 to 2019.
The COVID-19 pandemic has reinforced the importance of trustworthy data for governments, businesses, and civil society to make good decisions that affect everyone's lives and livelihood. Without such data, decision-makers are flying blind and citizens struggle to hold those decision-makers to account. The National Statistical System (NSS) is a core component of the fast-evolving national data system that has been the focus of the World Bank’s newly released World Development Report: Data for Better Lives.
They provide an essential public service, including many elements of national data infrastructure as well as a wide variety of products and services. Yet, in all countries, there is significant room for improvement if national needs are to be met and the potential of the data revolution is to be realized.
To assess the performance of National Statistical Systems and identify areas for improvement, the World Bank has developed the SPI, with the aim to help national statistical systems learn from one another and to facilitate the urgent need for transformation.
What’s new about the SPI?
The SPI builds on and replaces the World Bank’s Statistical Capacity Index (SCI), which has been in place since 2004. The SCI has been influential in bringing attention to the importance of building statistical capacity.
The SPI takes a deliberate shift from “capacity” to “performance”, with a forward-looking framework. The SPI has five pillars. Unlike a typical data value chain, it starts with data use, recognizing that statistics have no value unless used. The data use pillar is followed by data services, data products, and data sources pillars—capturing the key statistical outputs through which users interact with data. The fifth pillar, data infrastructure, ensures the capability of statistical systems to deliver these outputs and promote their use. Each pillar is divided into 4 or more dimensions; in all, there are 22 dimensions that reflect the common practical areas of operation in national statistical systems.
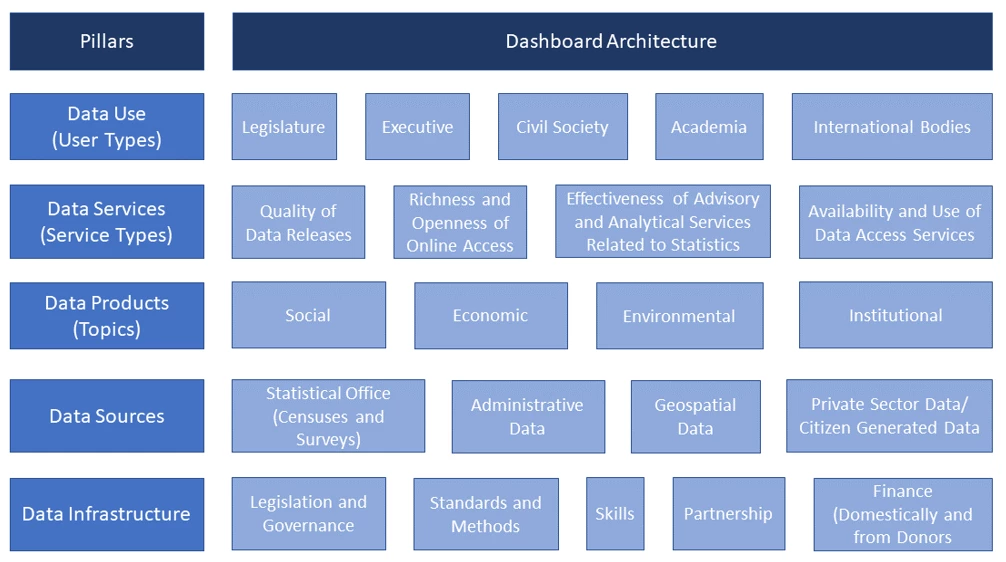
An overall score (ranging between 0 and 100) is produced for 174 economies by combining the Statistical Performance Indicators. In 2019, the scores ranged between 20 (Somalia) and 90 (Norway), with a median score of 59. The overall SPI scores are also disaggregated for each of the five pillars and 22 dimensions. This offers a 'dashboard’ architecture that unpacks a country’s overall statistical performance and helps identify where it leads and lags.
What do the SPI scores tell us?
SPI scores vary significantly across regions
North America is the region with the strongest average SPI, followed by Europe and Central Asia, while the Middle East and North Africa, and Sub-Saharan Africa lag most. However, even within regions there is significant variation in the SPI overall score.
While SPI scores are positively correlated with level of development, economies at the same level of income could achieve greater level of performance
Economies with higher per capita income tend to have better performing statistical systems as measured by the SPI. However, there are exceptions. For example, Mexico has a GDP per capita just over 10,000 (current USD); however, it performs as well as a country with twice its income level. There is also a strong positive relationship between the SPI overall score and the human capital index and indicators of government effectiveness.
31 of 34 FCS economies fall in the bottom 40% of SPI overall scores
Fragile and conflict-affected (FCS) economies tend to struggle in statistical performance. 21 of 34 FCS economies score in the bottom 20%, including countries like Libya and the Syrian Arab Republic. Another 13 FCS economies fall in the 2nd quintile of the SPI overall score. Non-FCS economies score around 25 points higher (68 versus 43).
Statistics about statistics are vital
The new SPI is intended to provide the world with a forward-looking framework that helps NSSs further evolve and design their systems with a user-centered approach. While the SPI offers a broad range of indicators, wide country coverage, and a strong conceptual framework, further efforts to improve the measurement of statistical performance are needed. For example, country-level statistics on data use and data infrastructure are patchy. With more investment, the SPI can be further refined by developing more relevant measurements and expanding data sources.
We hope that the SPI can help countries assess and compare their statistical performance and can offer an ambitious measurement agenda for the international community. Through the SPI, there is potential for countries and development partners to create mechanisms for learning from their peers and develop a virtuous cycle of investment, effectiveness, innovation, value addition, and impact.
The following resources are available to learn more about the project:
- The SPI Website provides an overview of the project, allows users to quickly explore the data, links to its technical note and research paper, and lists frequently asked questions.
- The SPI website also includes an Interactive Dashboard for a more detailed exploration of the data. You can map any of the 51 Statistical Performance Indicators, explore a visual report for individual economies, and see how the SPI overall scores change when alternative weights are applied to the dimensions and pillars.
- The SPI is also featured in the World Development Report 2021: Data for Better Lives.
- In an effort towards transparency, we publish raw data and the code used to produce the SPI in this Github repository. Users are encouraged to share or adapt any of the materials available with appropriate citation of the SPI team.


Join the Conversation