Building resilient infrastructure, promoting inclusive and sustainable industrialization, and fostering innovation are at the heart of SDG 9.
Transportation is essential for ensuring access to better economic, health, and education opportunities. However, globally, 1 billion people live at least 2 kilometers away from a good road, facing reduced access to jobs, healthcare, and schools. That is why one of the targets of SDG 9 (SDG target 9.1) is to expand the availability of reliable infrastructure, including transport, that can support human and economic development.
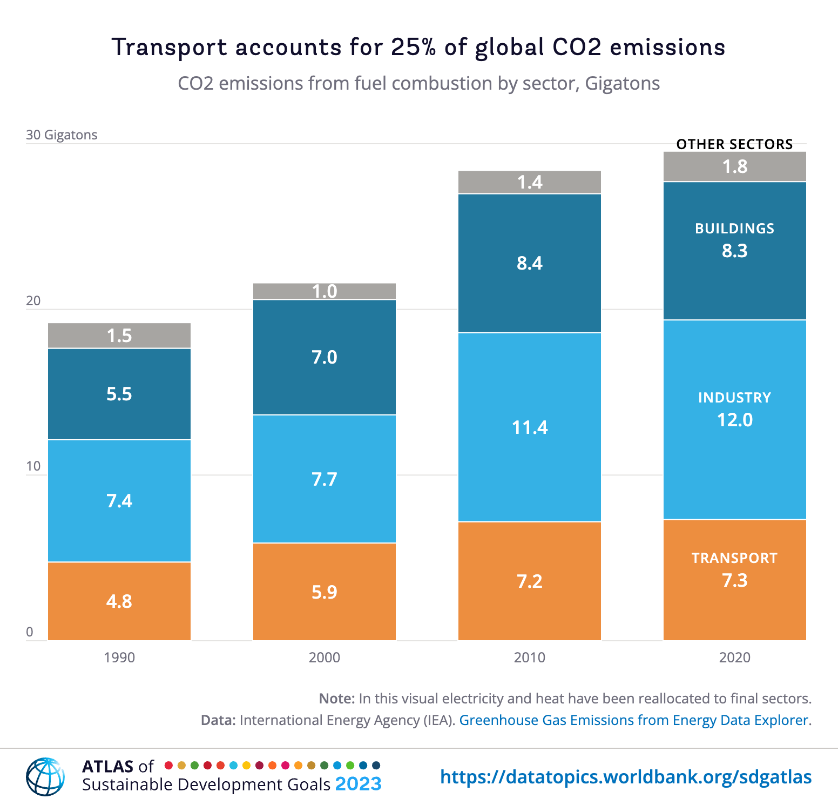
But transportation (by road, air, and sea) is also a major source of greenhouse gas emissions and hence a contributor to climate change. As you can see it in this chart from the 2023 Atlas of Sustainable Development Goals, the transportation sector accounts for a quarter of global CO2 emissions and about 16 percent of total greenhouse gas emissions. If transportation networks grow and rely on fossil fuels, transport emissions will increase by almost 60 percent by 2050.
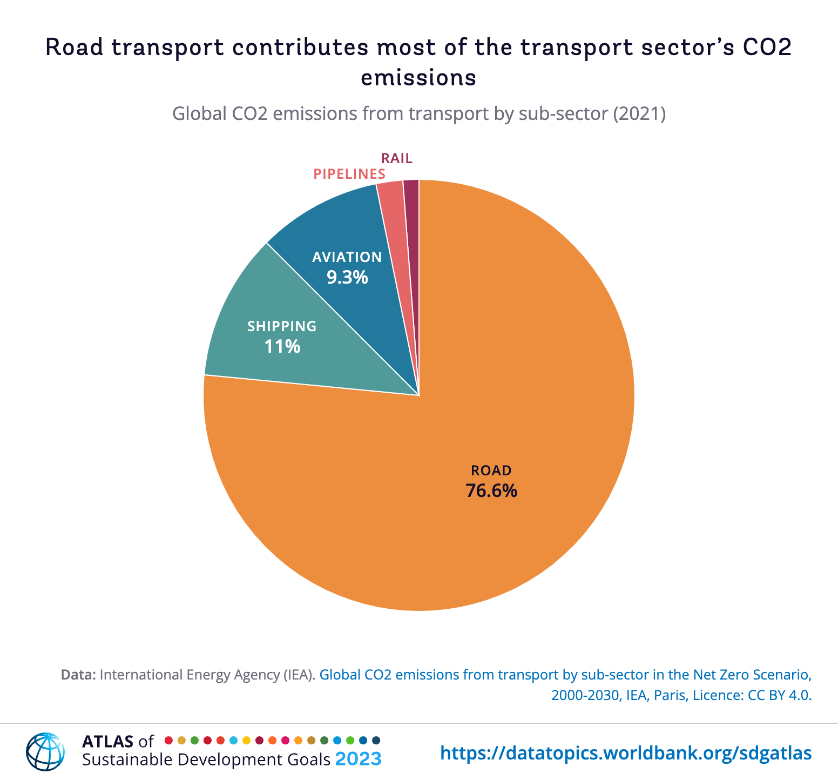
Road transport, in particular, accounted for 75 percent of the transportation sector’s global CO2 emissions (an average of 706 kilograms of CO2 emissions per person) in 2020, followed by shipping and aviation.
As a result, decarbonizing the transport sector is critical for tackling climate change, and countries face the challenge of expanding access to transport in a way that is sustainable and clean. As global mobility needs increase, it is imperative that current and future transportation needs are met in a way that significantly reduces the carbon footprint of the transport sector. Key to this goal will be the widespread adoption of stringent emission standards for vehicles worldwide, urban and territorial planning that favors public transport, cycling, and walking, as well as the adoption of new technologies.
Explore how different transport sectors contribute to global CO2 emissions in this data visualization of the 2023 Atlas of Sustainable Development Goals.
To learn more about how COVID-19 affected global transport volumes, which countries are the largest sources of greenhouse gases from transportation, and how demand for transportation is growing in lower-income countries, look at the data stories and visualizations of the ninth chapter of the Atlas.

Join the Conversation