Unpivoting Data with Excel, Open Refine and Python
This page in:
"How can I unpivot or transpose my tabular data so that there's only one record per row?"
I see this question a lot and I thought it was worth a quick Friday blog post.
Data often aren’t quite in the format that you want. We usually provide CSV / XLS access to our data in “pivoted” or “normalized” form so they look like this:
But for a lot analyses and applications, particularly data visualisation tools like D3, ggplot2, Tableau, it’s more convenient to have your data “unpivoted” or “denormalized” so it looks like this:
Although this is less space efficient, space is cheap, and it means there’s always only one record per row, so you can use simple functions to access and filter data.
Here are three ways to “unpivot” or “denormalize” your data - in effect, to transpose columns to rows and have one complete record per row.
Unpivoting Data With Excel (Windows only)
Several colleagues use the free Tableau Excel add-in for reshaping data. Tableau also provide a good tutorial for “preparing Excel files for analysis”
This approach is fine if you have Windows and Excel and are working on one file at a time, but many of us don’t use these tools and want tools that fit our own workflows better.
Unpivoting Data With Open Refine;
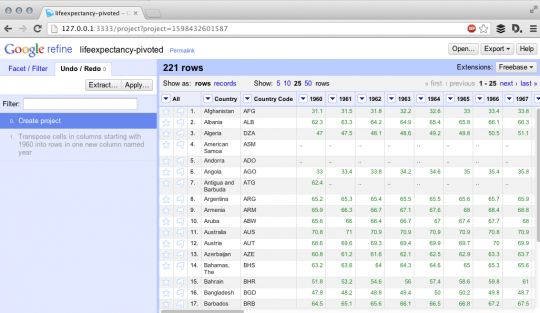
Formerly Google Refine, Open Refine is an awesome cross-platform open-source tool for “data wrangling” - that’s cleaning, reshaping and intelligently batch editing data. Once you’ve got it running, load your CSV. In this case I’m using a CSV for “Life Expectancy at Birth”. You should see something like this:

Now you need to click on the first column you want (in this case “1960”) click “Transpose” -> “Transpose cells across columns into rows”. You should see something like the below:

Make sure the “From” and “To” selections cover the range you want (I’m looking for 1960 -> 2011 or the last column) chooses “one column” named “year” to transpose into, select “prepend the original column’s name into each cell” a select “fill down into other columns. Hit Transpose and you’ll see that your data look like this:
![]() |
![]() |
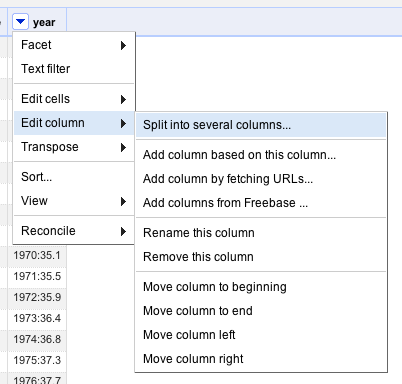
Nearly there - just click on year -> edit column -> split into several columns. Change the separator to “:”, hit OK, rename the resulting column “life_expectancy” and your data will now be in the right form:

You can now export this back out as a csv and you’re done.
Unpivoting Data With Python and pandas
There are a few ways of achieving the desired result in Python but my current favorite is to use the “melt” function (in pandas 0.12) from the reshape module in Pandas. This is very similar to melt in the R reshape library.You can check out this iPython Notebook I created to see it in action step by step, but this is the basic code that will do the trick:
And that’s it - You’ve now got a handful of ways to reshape data like the time series from the World Development Indicators into a format more suitable for analysis.
Also easy to do in Stata:
reshape long lifeexpectancy, i(countryname) j(year)
This works if columns in the pivoted ("wide") data are named "lifeexpectancy2005", etc. If not, replace it with the appropriate stub name before reshaping to unpivoted ("long") form.
I'm new to python programming ... i wanted to know that i have .xls file as input and i want to transpose the content of that into .csv as its output file
Hi Akshay, you can use the xlrd package to read xls files into Python and then just do the manipulation as above and use the csv module to create and write the ouput. A bit more information at: http://www.python-excel.org/
I've read the content of the xls file and write that content to the csv file but i want to pivot the cell content of the xls file into csv and remove those cell which don't have any content please give me demo of it so that i will go through the code
Sir , i have read the content of xls file here is my code
file= open('out.csv', 'wb')
wr = csv.writer(file, quoting=csv.QUOTE_ALL)
#open the xls file and read the content of the cell
book=xlrd.open_workbook("F.xls")
sheet=book.sheet_by_index(0)
for sheet in book.sheets():
for row in range(sheet.nrows):
wr.writerow(sheet.row_values(row))
all the content has mapped into csv file then for pivot the content i have done this
from itertools import izip
from csv import reader, writer
with open('out.csv') as f:
with open('output.csv', 'w') as fw:
writer(fw,delimiter=',').writerows(izip(*reader(f, delimiter=',')))
after this i will get the single row only
please let me know my mistake if found
We can manipulate values or anything else in Excel spreadsheets using VBA. So why shoud we use Python instead VBA? I have MS Office with Excel, and I can write some simple macros in VBA, so I see no need to learn Python for making scripts/macros. What is the advantage of using Python instead of VBA?
Python is more versatile and powerful. In years to come, there will be far more people using Python than VBA or any BASIC family language (VB, VBScript, VBAor VB.NET).
Python reaches and serves as wider audience.
Another solid reason is Excel's row limit - even though it's over 66k now (except for plots) size is not a real problem for text files nor the stats utilities which manage them so well (Python, R).
Athough this is an old thread. A response is still warranted...Use VBA, it is just as powerful as Python and a whole lot easier to start coding. Python is slow and clunky, otherwise there wouldn't be all these bolt on modules written in C to speed things up that has also been done for VBA so really Python has no advantage there. Python is still catching up to VBA in terms of elegance. The VBA IDE is far more convenient and easy to use than anything about Python. Remember that VBA is not limited to working with excel data, use the file obj or the database connection objects and excel just becomes a nice convenient location to put data for reports.
Hello, I think your site might be having browser compatibility issues.
When I look at your blog in Chrome, it looks fine but when opening in Internet Explorer, it has some overlapping.
I just wanted to give you a quick heads up! Other then that, fantastic blog!
This is awesome! Thanks for putting this together! I use your tutorial all the time and the Google Refine to transpose the Zillow Real Estate data for use in Tableau Public.
One thing I want to try to do is programmatically iterate through a folder containing several csv's, transpose them (using your python code) and concatenate them.
Do you know of some tricks for doing that? Thanks again!
Nice article! You can also combine Excel and Python to do more complex data reshaping and analysis within Excel using PyXLL (www.pyxll.com). PyXLL embeds Python in Excel so you can use packages like Pandas to operate on data while using Excel as your user interface. With this approach you can write really powerful analytics while keeping the familiar Excel front end for a productive work flow.