Researchers working on developing countries typically have more limited access to good quality labor market data compared to data available for higher-income countries. The global Jobs Indicators (JOIN) database was launched in 2019 to provide easily accessible and standardized indicators for labor market analysis with the goal of providing more reliable insights into the changing nature of jobs, employment structure, job quality, and wages in developing countries.
The Jobs Group has recently updated JOIN to latest years and enhanced quality checks. JOIN now provides key indicators of labor market outcomes from 168 countries across all income groups between 1970 and 2021 based on harmonized Labor Force Surveys (LFSs) and representative household surveys in the World Bank Global Labor Database (GLD), Global Monitoring Database (GMD), and Income and Distribution Database (I2D2) harmonization collections. The map below shows the geographic and numerical survey coverage.
JOIN global survey coverage
JOIN includes indicators on sociodemographic characteristics, labor force participation, unemployment rates, employment status by sector and by occupation, working hours, wages, and education attainment. All indicators are disaggregated by sex, education (below completed secondary and above), age (15-24 and 25-64), as well as location (urban and rural). For each country and year, the survey name indicates the harmonization collection used to generate the indicators (either GLD, GMD, or I2D2).
The latest JOIN update is based on 367 additional surveys and includes enhanced quality checks. It serves as a compliment to other sources like ILOSTAT. As opposed to ILO’s modeled estimates, JOIN generates indicators based on raw household survey data and labor force surveys (LFS) and does not impute data for years without survey. Moreover, JOIN does not try to reconcile different employment definitions to smooth definition breaks. That is, after a country has changed the definition of employment to exclude own-consumption work (e.g., in agriculture or construction), there is not an effort to reverse-engineer the previous employment definition from the questionnaire.
The methodology for checking the quality of labor market data applied to JOIN includes internal quality checks, validation with external data sources, and ad-hoc checks. Indicators are checked for internal consistency and coherence; for example, the working age group should be the sum of the group of younger (15-24) and older individuals (25-64), checking that the wage conversion is calculated correctly by redoing the process, looking at the distribution of variables over time to identify and flag outliers, and at the calculation of shares and checks on missing values.
External data used for validation is from ILO or the World Development Indicators: checks include how many JOIN indicators can be matched to external information, which variables are the ones matched, as well as a mix of different checks, such as how far wages and GDP per capita are different from each other. All surveys that are in the worst 5 percent according to the overall and core indicator flags produced based on quality checks are deleted as well as surveys with huge outliers in one of the core variables like population size, labor force size, sector composition, share of urbanisation, share of working age, employment rate, wage employment, or working hours. Only one survey in the same country and the same year is kept based on quality criteria.
The JOIN data can be downloaded in various formats from the dedicated JOIN Data Development Hub website . JOIN is available as a World Bank databank dataset, as well as an API. The whole dataset is also accessible as an Excel spreadsheet document, so that it can be filtered and pivoted directly – or read into statistical software programs for further analyses and visualizations.
JOIN indicators can be easily visualized. As an example, the below graph, calculated from JOIN, shows how the share of wage workers over total employment differs across countries by their income groups. The richer the nation, the larger the share of employees.
Share of wage employment: 2000-2019, by income group
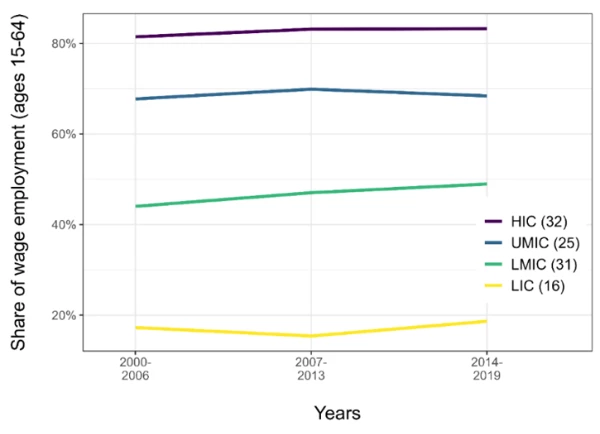
Calculated using JOIN indicators based on a balanced sample (only countries present at all time periods). Number of countries per income group in parentheses. Each point is the weighted average of county averages, using labor force as weight.
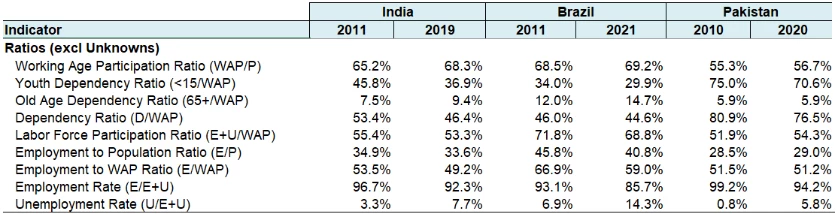
To help those less accustomed to statistical software and for quick analyses, the Jobs Group has also updated the JOIN Benchmarking Tool, an Excel Tool that allows users to generate ready-made cross-country tables and figures. The JOIN benchmarking tool is accessible here alongside a comprehensive video tutorial. The table below shows some key labour and demographic indicators benchmarked against peer countries (country choices and timeframes can be customised to user needs).
Key labour and demographic indicators for IND, BRA, and PAK
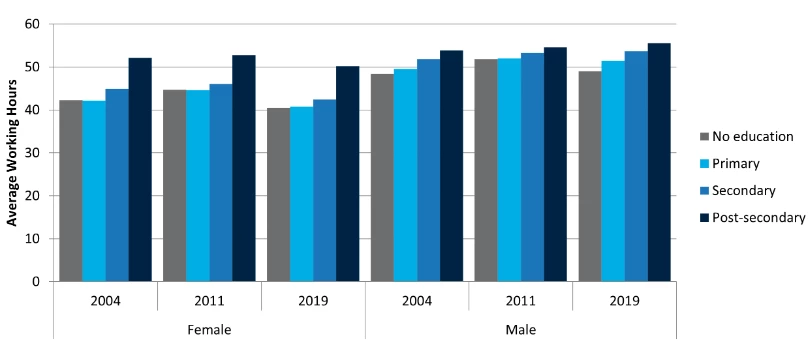
The figure below shows one of the many graphs built by the tool for the focus country: the average number of hours of work by education attainment and gender in India. Users can change the focus country with a few clicks. Moreover, the JOIN benchmarking tool leverages Excel, making it easy to change the graph in terms of content and format (e.g., switch from column organised within area to columns by sector and area in the legend).
Average weekly working hours by education level and gender in India
All the data sources, tools, and explanations are available in the Jobs Diagnostic Tools page and in the dedicated Global Jobs Indicators Data Development Hub site. Let JOIN guide your exploration!


Join the Conversation