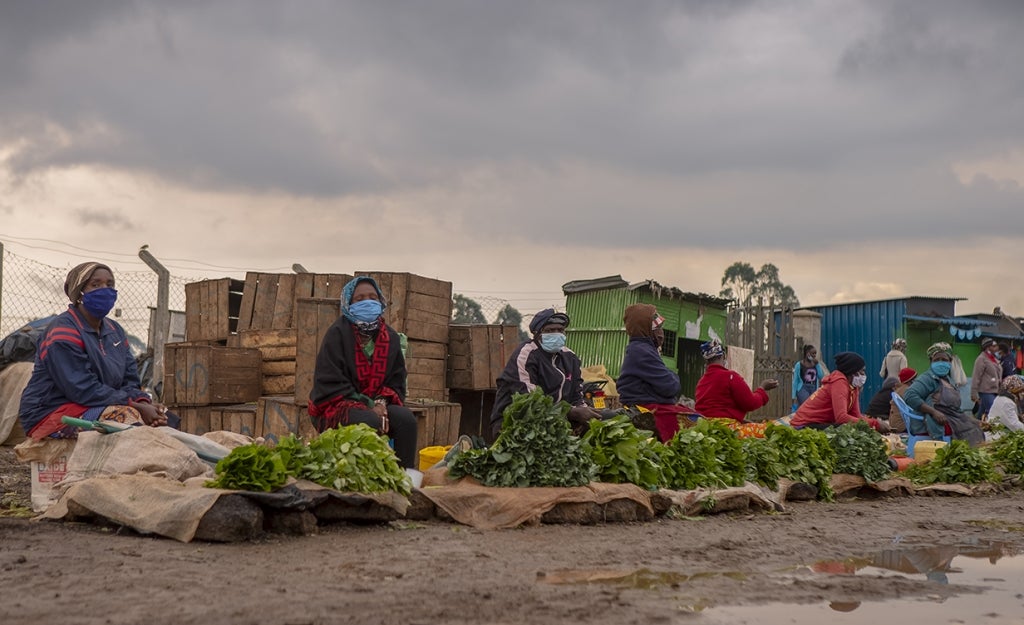
The Uganda Bureau of Statistics (UBOS) continues to monitor the impact of COVID-19 on the national population through Uganda High-Frequency Phone Survey on COVID-19 (UHFPS). The survey recontacts the entire sample from the Uganda National Panel Survey 2019/20 targeting households that had phone numbers for at least one household member or a reference individual. The first round of the survey was conducted in June 2020 while the latest sixth round was conducted in March/April 2021. The financing for data collection and technical assistance is provided by the World Bank and the United States Agency for International Development. This blog highlights the most interesting findings from rounds 4 and 5 conducted in October/November 2020 and February 2021 accordingly. These blogs discussed results from the first and the second rounds.
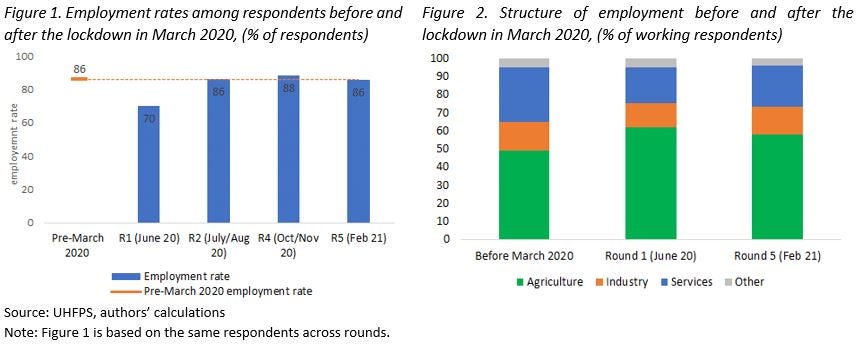
Employment among respondents has fully recovered since the introduction of the lockdown measures but family businesses and business revenues have not returned to the pre-pandemic values. Employment rates have reached pre-lockdown levels by July/August 2020 and remained about 86%-89% afterward (Figure 1). Despite a full recovery, the structure of employment has not returned to the pre-March level and the share of agriculture remained quite high close to 60% (Figure 2). Ownership of family businesses has been recovering since June 2020 as well, but not fully. The share of households with open family businesses increased between rounds 2 and 4 but stagnated afterward with about 8% of businesses still being temporarily closed (Figure 3). About 50% of households in February 2021 reported business revenues to be lower than the average before the lockdown.

Household income showed signs of significant improvement, but income levels have not recovered to the pre-pandemic levels for many households. Respondents were asked how current income compared to the average monthly income during the 12 months period prior to the schools’ closure in March 2020. This question was asked both in October/November 2020 and February 2021 and results are reported in figure 4 for the key income sources. There was a noticeable improvement in income levels for some households which resulted in narrowing the gap between income levels in February 2021 and the pre-pandemic levels. At the same time, for about 40%-55% of households, income levels remained lower vis-à-vis pre-March levels. Recovery in income levels was more pronounced among farming and wage income compared to nonfarm family businesses and family assistance, either because the former sources were affected the least or recovered faster.
Regarding concerns and following safe behavior, respondents demonstrated fewer fears about getting seriously ill from COVID-19 accompanied by a falling prevalence of safe practices. The share of respondents who were very worried about themselves or other family members getting seriously ill from COVID-19 declined from 58% in June 2020 to 26% in February 2021. During the same time, there was a large decline in safe practices in rounds 5 and 4 vis-a-vis round 1. For example, the share of respondents who avoided large groups of people declined from 91% in June 2020 to 41% in February 2021. The decline in safe practices may be related to a reduction in concerns but can also be a result of easing lockdown measures and overall tiredness from taking coronavirus precautions.
For the first time since the pandemic, the UHFPS collected information on the mental health of respondents. About 5% of respondents had clinically significant depression with a much higher prevalence among respondents without formal education, the elderly, and those not employed.

More detailed information from the analysis of rounds 4 and 5 is available here, while the microdata and related documentation are freely accessible at the World Bank’s Microdata Catalog here.
The members of the team working on the Uganda High-Frequency Phone Survey on COVID-19 (listed in alphabetical order for each institution) are: UBOS: Henry Mubiru, Andrew Mupere, Vincent Ssennono; World Bank: Aziz Atamanov (Poverty and Equity GP), Frederic Pierre Francois Hugue (LSMS), John Ilukor (LSMS), Talip Kilic (LSMS), and Giulia Ponzini (LSMS).


Join the Conversation