 A view of land submerged in Sindh.
The floods had severe consequences for rural communities especially women, young children and the elderly. The death toll rose, and waterborne diseases went on the rise. With an already stressed healthcare system, families could not reach health facilities in time. Spatial disparities in the form of human development and accessibility to services including schools, health facilities and administrative centers already existed in these areas. The floods exacerbated existing inequalities and access to basic services. Relief and rescue efforts were further compounded by lack of all-weather transport infrastructure. Communities were cut off for weeks.
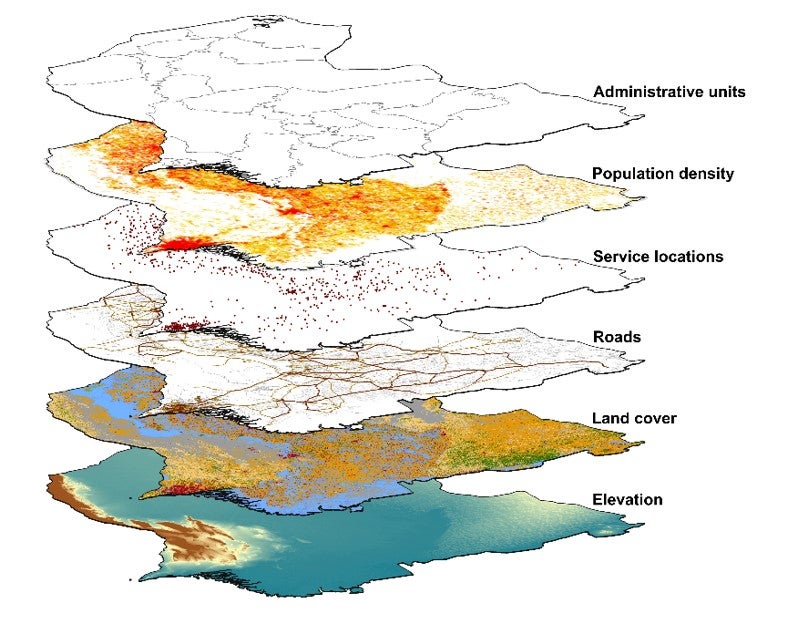
Evaluating the extent of the damage and urgency to optimize limited resources was a challenge. Hence, on the request of the Government of Pakistan, the World Bank mobilized its financial resources to reconstruct key transport infrastructure through a recently developed model that estimates accessibility to services at small scales using geospatial and remote sensing data (Figure 1).
Figure 1: Data inputs for accessibility modeling
Meeting the challenge of assessing accessibility
The model predicted travel times to essential services such as schools, health facilities, and administrative centers. It assumes multi-modal travel, considering terrain, land cover, and seasonality. Walking and vehicular travel speeds are estimated by considering different road types, surfaces, and conditions. This information also gauged the most efficient route between a populated location and the nearest essential service.
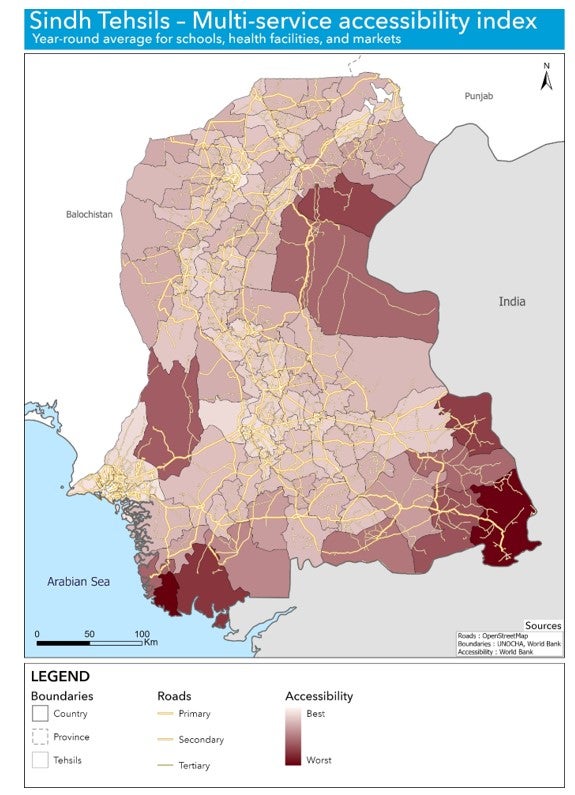
In addition to the detailed model, the teams used population- weighted travel times and merged results for different services to create an overall “accessibility index” which was determined for each administrative unit. The index not only provided key insight for each locality but also revealed spatial disparities in service provision across localities. These disparities, shown in Figure 2, illustrate the averaged, year-round multi-service accessibility index to services for Sindh’s tehsils.
Figure 2: year-round multi-service accessibility index to services
Assessing climate shocks
As a baseline (before floods) for the flooding analysis, the modeling previously described was first carried out to determine baseline accessibility conditions. To simplify, these indices were converted into travel times. For instance: What’s the average travel time in hours that a person walks in a typical monsoon season (from June to September)? Baseline estimates were then contrasted with travel times after the shock flooding (from August to October).
Floods exacerbate spatial disparities
Districts are indexed in terms of their inaccessibility relative to each other. A higher inaccessibility score indicates a lower level of access. In Jacobabad district, the situation resulting from the floods was particularly severe, with a 10 hour increase in average travel time per person to reach a health facility. For the Sujawal district, the average travel time per person to reach markets increased to 13 hours compared to 2.6 hours during the “typical” monsoon season.. These negative effects on accessibility directly affect the effectiveness of the response, short and longer-term human capital outcomes, and economic development and recovery of the area.
Leading the response and sustainable change on-the-basis of evidence
Understanding existing and widening geographic disparities in access to services is key to developing effective policies and projects. The model, created during such a devastating event, is an innovative approach to addressing the challenges that emerge in reconstructing infrastructure in situations where project teams face physical constraints. The newly created accessibility index can not only help in the immediate response effort but also in the longer-term reconstruction effort and investment decision-making to help close spatial disparities in access to services. These tools exemplify how effective use of data can help in the optimization of overall budget utilization for infrastructure development. They make an evidence-based case for targeting investments in areas that governments usually overlook. Moreover, having documented access times to key services can also be used for the selection of future sites needing infrastructure and essential service investments.
We’d like to highlight that this model is replicable and scalable in other settings affected by shocks, across geographic regions, and to support the work of sectors engaged in response efforts. Going forward, it will be essential to not only invest in the collection of robust data and data ecosystems but also to devise tools. Most importantly, decision-makers must be engaged to use such analytics in their response effort and for future investments that aim to close spatial disparities.


Join the Conversation