In an effort to address these and other related questions, the World Bank Group has just launched the report East Asia’s Urban Changing Landscape: Measuring a Decade of Urban Expansion, which presents the findings of a new major study on urbanization in East Asia. In conjunction with this launch, the Bank Group also released PUMA or “Platform for Urban Management and Analysis.” It’s a free open source software tool that lets users access, analyze, and share urban spatial data. Read the news here.
To conduct the study, our project team used satellite imagery for the years 2000 and 2010 to measure urbanization across the East Asia region. This approach allowed us for the first time to compare trends among countries in a consistent way. This has been impossible so far because, as mentioned above, each country defines “urban” differently, and because urban data often do not capture urban land and population that spills over city boundaries.
With the help of researchers at the University of Wisconsin-Madison, we mapped all built-up areas across the entire surface of the region, combined it with spatially disaggregated population data from the WorldPop project, and identified all 869 urban areas in the region with populations over 100,000. You can find all the data and maps here.
An open source tool with open data covering more than 869 urban areas in East Asia
PUMA is built on the open source GeoNode Geospatial Content Management platform and with processed MODIS (250m) satellite imagery, provides comparable data on the pace, scale and form of urbanization in more than 870 cities in the region.
Unless labeled otherwise, the data and visualizations in the tool can be used under the CC-BY 3.0 IGO license. As data are coming from multiple sources, we’ve done our best to make the usage and citation requirements clear in the user agreement so please take a moment to review it!
The study allowed us to quantify and locate the rapid urban expansion and population growth across East Asia. While over 28,000 square kilometers of new urban area were built over the decade, urban population grew even faster than urban land. The total population of the region living in these urban areas grew by 200 million people over the course of the decade, reaching nearly 780 million in 2010. Still, only around a third of the population of the region lives in these urban areas, suggesting that future decades will see even more urbanization.
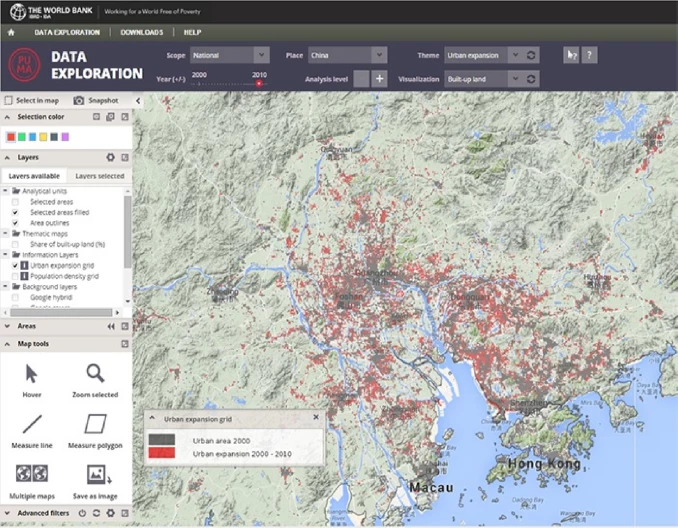
China’s Pearl River Delta area now larger than Tokyo in population
According to our data, if China’s Pearl River Delta (which includes cities like Shenzhen, Guangzhou, Foshan and Dongguan) is considered a single interconnected urban area, which the map arguably suggests it has become, it has now overtaken Tokyo to become the world’s largest megacity. Its population in 2010 was an amazing 42 million people, more than Canada or Malaysia.
Still, despite the high visibility of these megacities, there is in fact more urban land and population in the region’s hundreds of small and medium urban areas, which are often overlooked, and whose local governments lack the capacity to cope with rapid growth.
East Asia’s newly urbanized populations are getting denser than average
A more unexpected finding of the study is that urban population densities in the region are not just high (over 50 times the population density of metropolitan statistical areas in the United States, for example), but that they are in fact increasing on average – across income groups and population size categories, and in almost every country. One way to think about it is this: if all the new urban land built between 2000 and 2010 formed a country, it would be the size of something like the 143rd largest country in the world by area; if you made a country from the new urban population during the same period, it would be the world’s sixth largest country.
However, there were a few hundred urban areas that did lose density, almost all of which were in China. As the recent study of urbanization in China discusses, there are concerns that there is a mismatch in the location of demand and supply of urban construction in China, which in some cases has led to ‘ghost cities.’
The study also allowed us to quantify the administrative fragmentation of urban areas across local boundaries. This is not just a concern in the region’s ‘megacities’ – around 350 urban areas in East Asia spill over local administrative boundaries. In 135 of these, no single jurisdiction has even half of the total urban area within it.
Helping governments make urbanization more efficient, sustainable, and inclusive
The report discusses ways in which governments across the region can help make urbanization more efficient, sustainable and inclusive. Governments can facilitate access to urban land through mechanisms like guided land development or land readjustment, coordinate growth across entire systems of cities, and foster cooperation across metropolitan areas. They can ensure spatial access to jobs and services to make urbanization more inclusive, particularly for their large numbers of recent migrants, many of whom lack social and economic support systems.
The high population densities in East Asian cities can be an economic and environmental asset, but high density alone is not sufficient for sustainable, livable urban areas. Governments have a role in ensuring that density is allowed to develop where there is demand for it, channeled away from unsafe areas, coordinated with jobs and transport, and designed to be walkable and accessible.
Two competitions on these data now open
To accompany the data release, we are also inviting the public to participate in two competitions to use this data set to 1) create data visualizations, and to 2) propose ideas for further research using the data. We are excited to hear your feedback on the report and our findings, and hope the data generates a more informed dialogue around the transformative phenomenon of urbanization in East Asia.

Join the Conversation