") Children in Taiz, Yemen. (Shutterstock.com/anasalhajj)
Children in Taiz, Yemen. (Shutterstock.com/anasalhajj)
After eight years of military conflict, Yemen’s economy remains highly fragile. Humanitarian needs are increasing due to compounding crises, and the already dire socio-economic conditions are worsening due to poor institutional capacity, uncoordinated policy decisions, and the duality of administrative establishments
Yemen's GDP contracted by 47 percent in real terms, between 2011 and 2021. The UN estimates that over half of Yemenis suffer from food insecurity at crisis levels that require urgent action to avoid malnutrition or starvation, and more than half of the 233,000 deaths by the end of 2020 alone, were not directly caused by violence, but rather were the indirect result of a lack of food, healthcare, or infrastructure.
Glimmers of hope were recently provided by a UN-sponsored truce (extended since April 2022). Days after announcing the truce, President Abdrabbuh Mansur Hadi transferred authority to a “Presidential Leadership Council” on the last day of GCC-sponsored peace consultations. Only hours later, KSA and UAE announced a US$3.3b financing package. Despite these encouraging recent developments, achieving a full understanding of conditions on the ground is extremely challenging due to the lack of data, which remains scant and hard to collect in current security conditions.
In this context, we decided to apply satellite-derived and geospatial data, statistical and machine-learning models to assess the economic and environmental effects of the conflict in Yemen. This work combines data from a wide range of sources, including satellite-derived data on land use, climate, nighttime light production, and population. Also used is World Food Program (WFP) data on commodity prices, territorial control information provided by the Crisis Group, and conflict event and fatality data from ACLED.
The results highlight key economic differences in the territories controlled by the two main sides and reveal environmental factors that have influenced food prices. They also provide rare quantification of the expansion of qat plantations (Qat is a narcotic substance which is legal to grow and use in Yemen, and has significant implications on overall agricultural productivity).
Satellite data show a significant drop in nighttime light emission in 2015, which could indicate a decrease in economic productivity in Yemen at the start of the conflict. For instance, between early and mid 2015, total nighttime light radiance dropped over 60% in the Aden governorate and dropped over 90% in the Sana’a City governorate. Many areas show a substantial increase in the emission of nighttime lights since 2015, which may reflect a gradual economic rebound as the private sector has progressively adapted to the new context, although the improvement has been uneven across the country. For instance, by 2018 nighttime light levels in Aden rebounded to levels approximately 80% of pre-conflict radiance, but in Sana’a City radiance was still far below pre-conflict levels through 2021.
To better understand the factors that have affected food commodity prices during the conflict, we modeled the evolution of food prices in 24 markets throughout Yemen and aggregate food prices into a “food basket price” of five major commodities, fashioned after the supplemental rations provided by the WFP.
This commodity price model captures a nationwide trend of price increases throughout the conflict, as well as more specific features such as a dramatic spike in prices in the second half of 2018 related to the conflict in the port of Hodeidah, located in western Yemen on the Red Sea coast, a critical entry point for food and aid. The case of Hodeidah is a powerful example of the potential for localized conflicts to have nationwide economic effects, as the conflict there drove up food prices about 40% across Yemen until a truce was negotiated in December 2018. The regression model also highlights the notably faster increase in prices in IRG territory compared to DFA territory since the start of 2020, reflecting diverging monetary policies.
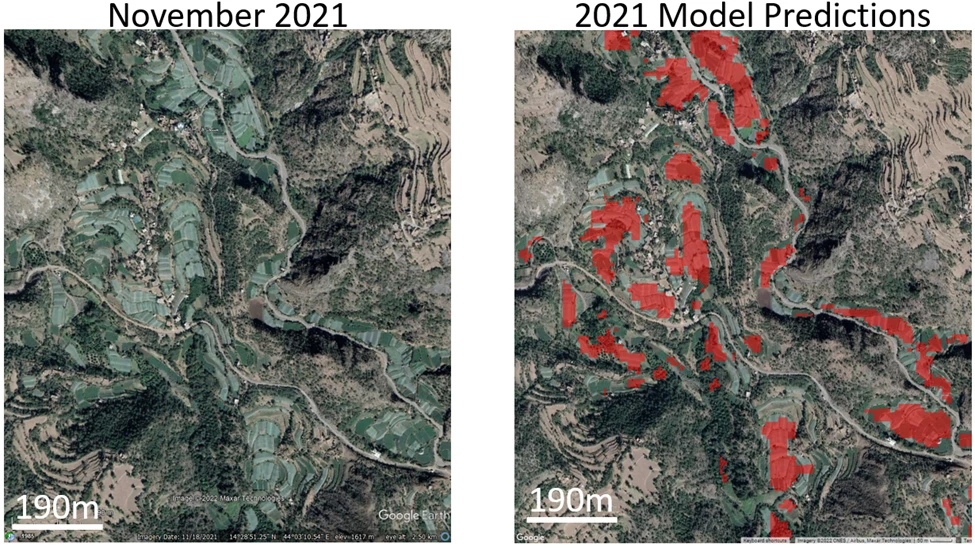
The satellite-based analysis also focused on Qat. Qat has a strong cultural and historical component in Yemen, and its presence is documented as early as 1762. Over recent years, the production of Qat has significantly expanded, with ample anecdotal evidence suggesting that a large part of the Yemeni population currently uses qat on a daily basis. This expansion has seen agricultural land converted from food to qat production and water diverted from food crops. Until now the expanded use of land for qat has been difficult to quantify. Our analysis through machine learning models and remotely sensed data was able to pioneer estimations of the change in qat plantation areas in selected Yemeni regions from 2016 to 2021. These initial models estimate that the area devoted to qat has increased by over 40% since 2016.
When peace is achieved in Yemen, and hopefully soon, a serious post-conflict discussion will benefit in a big way from an accurate accounting of past socio-economic trends. This analysis means to contribute to this high-level goal, to promote more informed (and therefore effective) aid delivery as well as to contribute to the legitimate ambitions of the Yemeni people to live prosperously. This work will be further developed as part of a forthcoming Country Economic Memorandum on Yemen by the World Bank.
Fig 1. Nighttime light radiance in the capital governorates of the two primary territorial groups. Values scaled as a percent of the average value in 2014 for each governorate. Inset: locations of Aden and Sana’a City in Yemen, with DFA and IRG territorial control at the end of 2021 (from the Crisis Group).
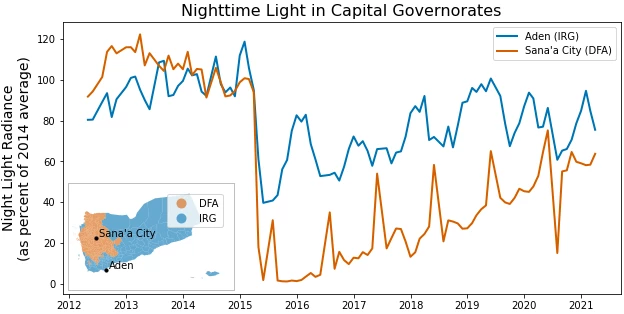
Fig 2. District-level food basket prices in Yemeni Rial (YER) separated by IRG or DFA territorial control. Modeled prices are shown in blue. Observed prices for each district are shown in gray.
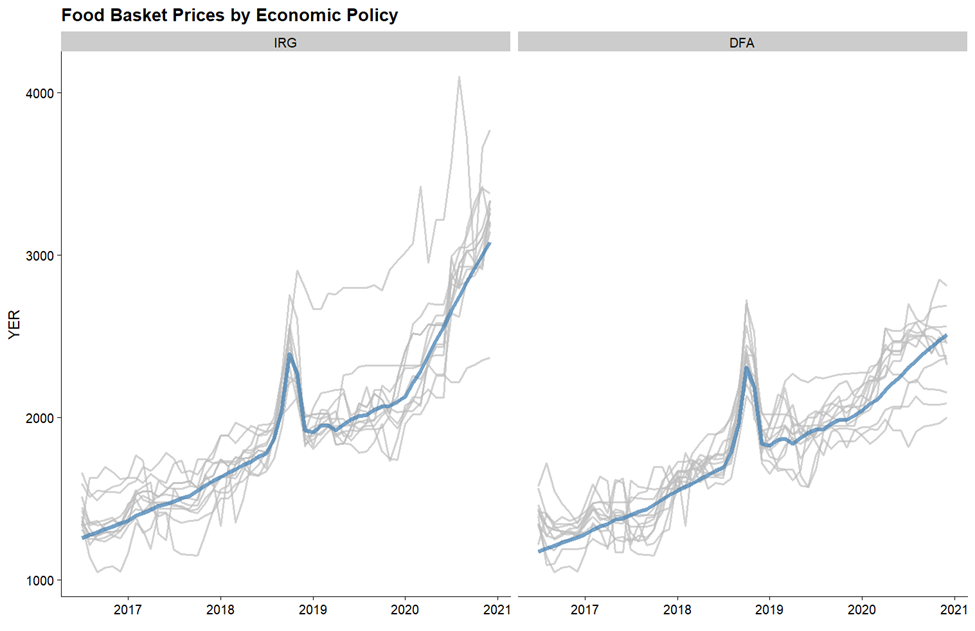
Fig 3. Satellite photography (left, from Google Earth) and model predictions of qat plantations (red pixels at right) in 2021 for a region of Otmah district in Dhamar governorate, Yemen. Model predictions show a good match to qat plantations (here primarily appearing light green) while avoiding natural vegetation (here appearing dark green) or other crop fields (here appearing brown).


Join the Conversation