 The paper sheds light into the main challenges imposed to Lithuania’s tax system, a modern OECD country trapped in a transition-economy style. Photo: ndanko/Envato Elements
Two key principles of good tax policy are neutrality and horizontal equity. Neutrality means that the decisions of agents should not be affected by tax considerations, since these might distort optimal choices. Horizontal equity means that taxpayers with similar characteristics, and with the same income, should pay the same amount of taxes. Of course, tax policy might sometimes move away from these principles for good reasons—health taxes are one example of a policy tool used to encourage changes in harmful consumption behavior.
Tax systems that ignore these principles lead to large inefficiencies and fail to address equity concerns. Take the example of schedular tax systems, where different types of incomes face different tax schedules or rates. First, these systems create incentives for individuals to engage in certain activities that generate incomes that have preferential rates—even if these activities are not the most productive ones—or to mislabel their income sources. Second, schedular systems often undermine the goal of progressivity— that is, taxing higher incomes at higher rates. Consequently, it is hard to apply an overall progressive rate when incomes are taxed individually rather than be aggregated. Finally, these systems can generate very different tax rates for individuals with similar income levels. For example, if one individual receives their income only from wages, but another individual has a mix of self-employment and dividend income, their tax liabilities might be widely different due to differences in tax rates by income type. These considerations are not only relevant for individuals, but also for firms. If different size firms pay vastly different income tax rates, they will face strong incentives to avoid growing above certain levels.
All these issues exist in Lithuania’s tax system, a modern OECD country trapped in a transition-economy style income taxation system. Lithuania has enjoyed remarkable economic growth in the last decades and has bold plans to invest in green and digital innovation going forward. Still, the country has high income inequality and low wages when compared to other European Union economies, and also collects less taxes as a share of GDP when compared to other Baltic and OECD economies. These challenges should be seen in the context of an extremely schedular tax system that potentially generates inefficiencies and vertical and horizontal inequities, both for firms and individuals. On the corporate side, firms with revenue above a certain limit face much higher tax rates, discouraging firm growth and encouraging tax evasion. On the individual side, taxable incomes are classified in over 70 categories, several facing their own tax schedule. This creates very strong incentives for income shifting, inefficiencies in economic choices and inequities among taxpayers with similar income levels.
In a recent project carried out with funding by the European Union in cooperation with the European Commission’s DG REFORM, we collaborated with Lithuanian authorities on a diagnostic of the current income tax system, using administrative microdata, and simulated the revenue impact of possible reforms. On corporate taxes, we evaluated firms’ responses to income tax that vary by firm size and its implications for firm growth. On personal income taxes, we documented how the multitude of tax rates by income types undermine progressivity and horizontal equity and looked at reform scenarios that tax aggregate income. We summarize the project’s main findings below.
Tax rates that vary with firm size distort firms’ behavior
When taxes increase sharply at an arbitrary level, firms respond by reporting revenue right below that threshold. Corporations in Lithuania face two tax rates on their income: a standard 15 percent rate and a reduced 5 percent rate for companies with less than ten employees and declaring turnover below €300,000 (approximately US$324,000). This sharp increase in average tax rates when firms declare slightly higher turnover generates strong incentives to reduce declared turnover. For example, a firm with turnover of €299,900 and profit (taxable income) of €15,000 faces a 5 percent tax rate and will pay €750 in taxes (figure 1). If the same firm had reported a turnover of €300,001 while keeping profits constant, it would face a 15% tax rate and would pay €2,250 in taxes. In our working paper, we document that many firms respond by declaring turnover precisely below €300,000. We estimate that, every year, five times more firms than expected (up to 250 firms) locate in that area. Such behavior resulted in tax revenue losses of up to €6 million between 2015-2020.
Figure 1: Empirical density of turnover (2015-2020)
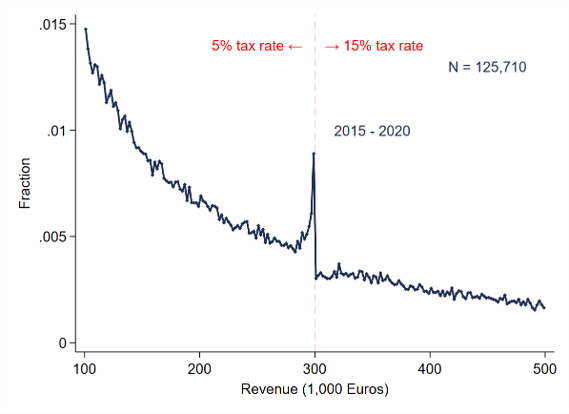
Note: This figure shows the empirical density of turnover for firms in the period 2015-2020. Bins are €2,000 wide.
Not only do firms report revenue below the threshold for one year, but this behavior persists over time: firms that start right below the threshold grow less than those that started above the threshold (figure 2). Whereas the median firm grows between 1 percent to 2 percent per year on average over the study period, a clear exception are those that declare turnover precisely below the threshold: if we observe a firm declaring turnover between €280,000 and €300,000, and therefore close to transitioning to the higher bracket regime, more than half of them will declare zero or negative growth the following year, a stark departure of other firms in the economy. We also document that this behavior accumulates over time, such that in a five-year period those starting slightly below the threshold grow less than those slightly above.
Figure 2: Revenue dynamics–growth rate around €300,000
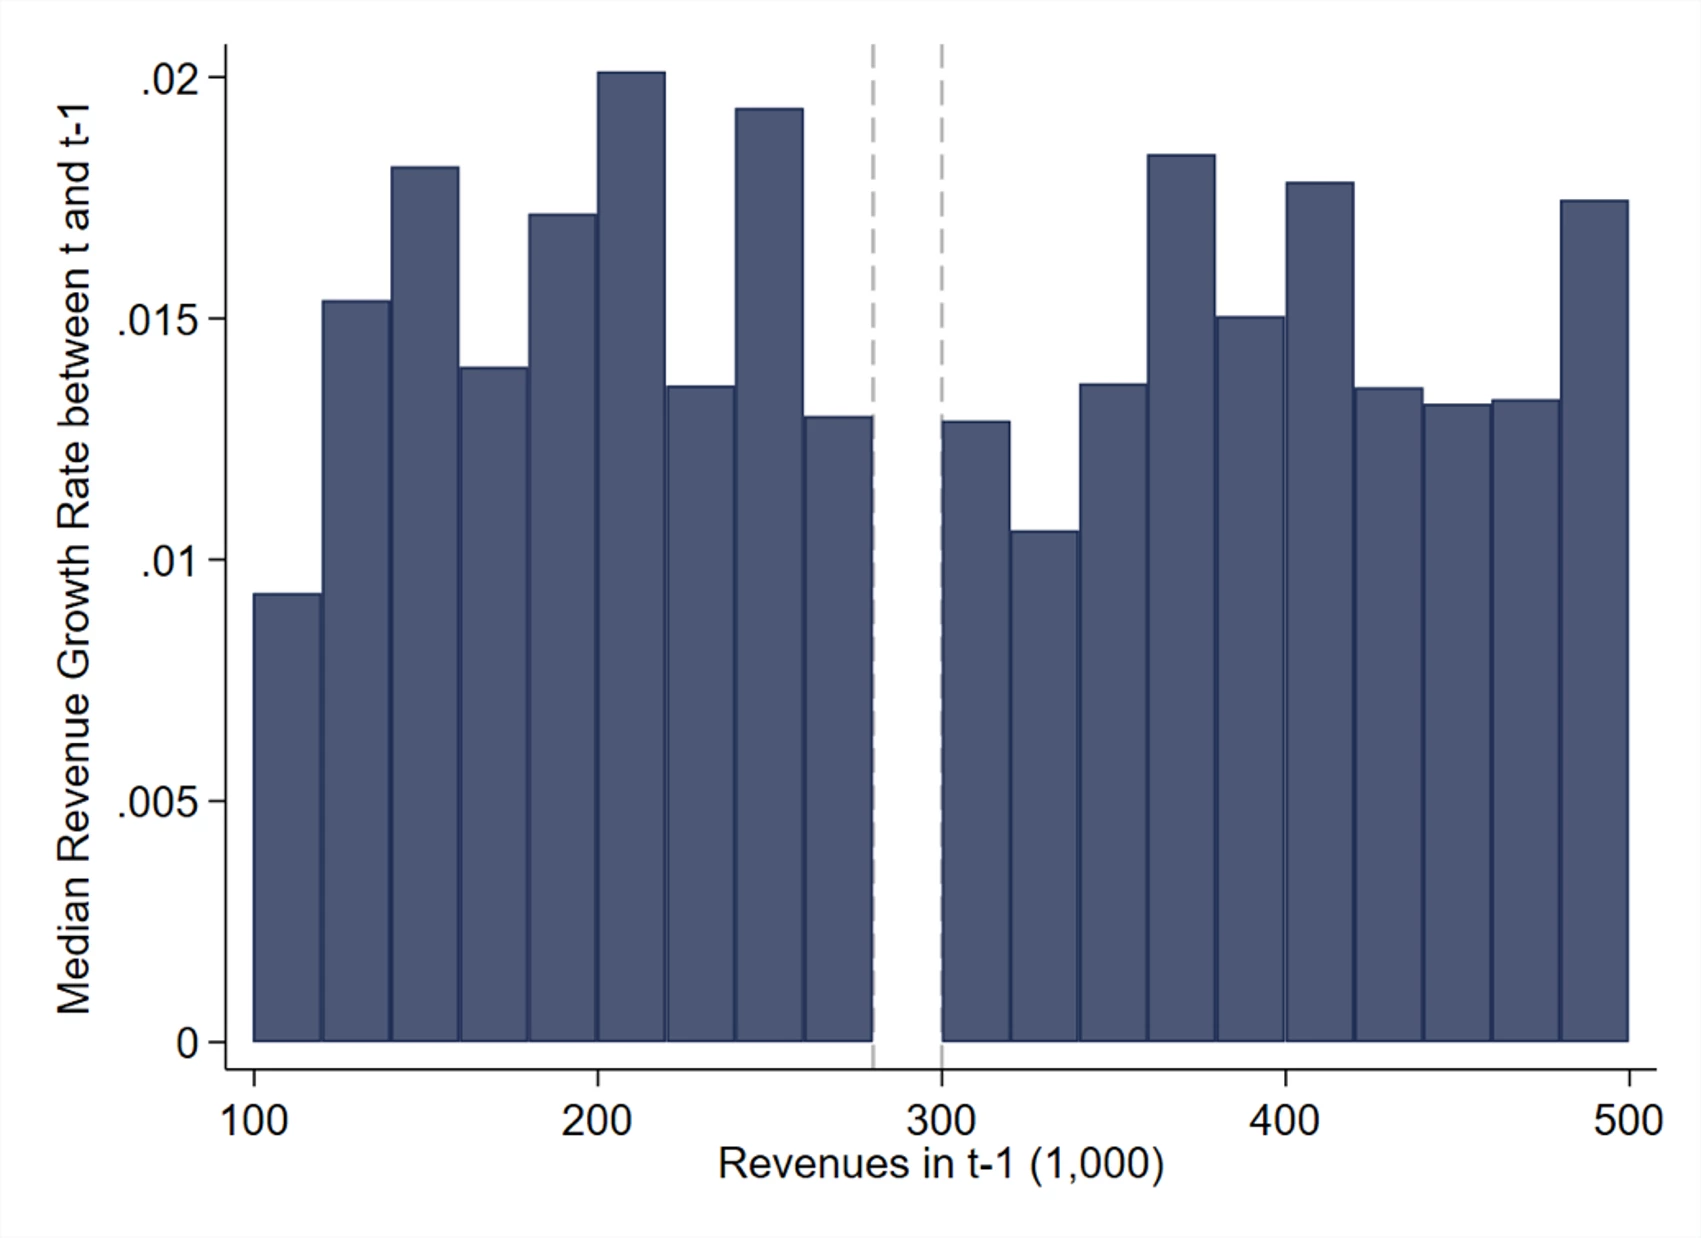
Note: This figure shows the median yearly turnover growth for firms in the panel (2015-2020), for different bins of turnover in the initial year. Bins are €20,000 wide.
Individuals at the top of the income distribution benefit from lower tax rates
Individuals in Lithuania pay very different tax rates depending on the source of income. Beginning in 2020, workers faced a progressive tax schedule on their wages, with rates of 20 percent and 32 percent, with a minimum non-taxable income. Self-employed workers, on the other hand, can declare income from several different sources that are taxed differentially –some of them taxed progressively between 5 percent and 15 percent, and others which are virtually exempt up to €45,000 per year. There are also different tax rates for dividends (15 percent) and several sources of capital gains (15 percent to 20 percent), a more common tax differentiation for income from capital.
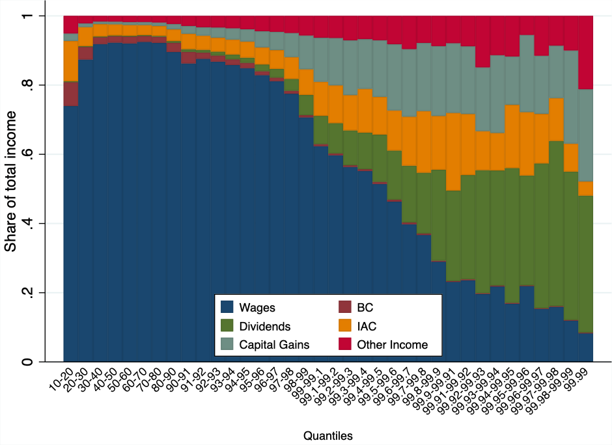
Lower rates on some self-employment activities are intended to benefit smaller enterprises. Nonetheless, we document that a large share of the benefits from reduced rates accrue to individuals in the higher deciles of income distribution (figure 3). For individuals in the bottom 90 percent of the income distribution these incomes represent up to 4 percent of total earnings, while for those in the top 1 percent of the distribution self-employment incomes amount to 10 percent of total earnings. In addition, these differentiated tax rates also mean that individuals with same income levels will face vastly different rates depending on the declared source of their income: among the top 1 percent, 10 percent of taxpayers have an effective tax rate of close to 0 percent; 25 percent are paying less than 12 percent and the top 10 percent pay effective rates of more than 20 percent. The multiplicity of tax rates (for capital, wage, and self-employment incomes) produces a wide dispersion in effective rates paid.
Figure 3: Income composition across the distribution (2020)


Join the Conversation