Despite years of fiscal decentralization, not many countries have been able to quantify the size and structure of the economies at the decentralized units. To our knowledge, only South Africa has done this within the African continent, with Gross Domestic Product (GDP) per region estimates (1995-2006) made available in November 2007.
Estimating GDP is a daunting task, and doing so at subnational levels is even tougher in part due to data challenges, prevalence of informalities, and difficulties in attributing economic activity to a specific subnational unit. Nonetheless, as countries decentralize, quantifying subnational economic activity and its relative size is becoming increasingly relevant and a common client-driven request.
In a new initiative, the World Bank under the Kenya Accountable Devolution Program (KADP) partnered with the Kenya National Bureau of Statistics (KNBS) to produce the 2017 Gross County Product (GCP). With technical and funding support from the Bank, KNBS embarked on estimation of the net value added at the county level in 2017. After months of work, the estimates were released in February 2019, providing for the first time a credible and official quantification of the relative economic size of Kenya’s counties (Figure 1).
Figure 1: Counties’ average contribution to Gross Domestic Product in Kenya (2013-2017)

Plugging this data gap for Kenya, a country that adopted a devolved governance structure in 2013, has attracted great attention, for four reasons. First, there is strong policy interest within county governments to know the size of their economies as they chart their economic development plans. Second, understanding the size of counties could also indicate their potential to raise their own revenues which could form a performance benchmark in the horizontal revenue allocation formula. Third, the estimation of level and growth of economic activity at county level provides a critical indicator for monitoring progress across counties. Fourth, the national government could use the estimates to assess the dividend of devolution and growth of counties over time. This could also help identifying counties that requires more focus for inclusive growth and pro-poor policies.
What did we know about Kenyan county’s relative sizes? A pioneer Policy Research Working Paper by researchers at the World Bank used the ‘night lights’ approach to estimate subnational 2013 GDP growth and levels for 47 counties in Kenya. The use of night lights as a proxy for economic activity was based on a strong assumption that almost all consumption and investment activities at night require lighting. While the publication generated praise and condemnation in equal measure, it left a genuine desire for official statistics. More importantly, the paper showed that although Nairobi was the main contributor to national GDP (at 13%), that contribution was much lower than the 60% commonly cited.
Through the report, we found that there are significant differences in the size of economy across counties. Urban counties – Nairobi (21.7%), Nakuru (6.1%), and Mombasa (4.7%) – made large contributions to the national GDP. This indicates large disparities in the size of GCP across the counties but also elevates the uniqueness in each of these units in tackling the pressing needs of reducing poverty and promoting inclusive growth.
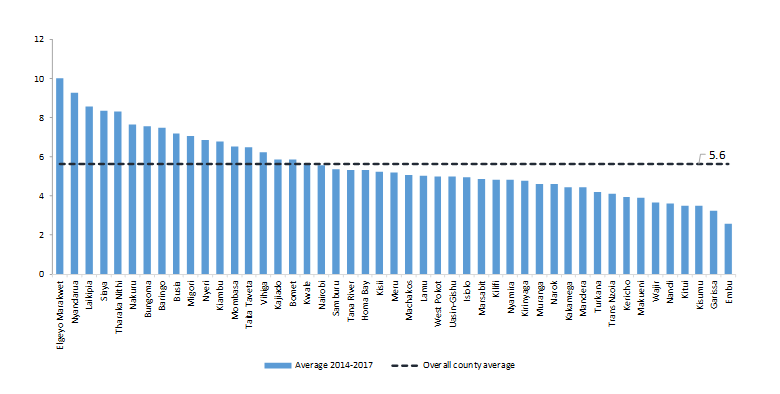
Although some counties have a small contribution to the national cake (as share of GDP), they show greater potential with a faster rate of growth over time but also potential for catch-up with the dominant contributors (Figure 2). With the exception of Nairobi and Mombasa counties, agriculture remains a key driver of growth in most counties.
Figure 2: Average growth in counties relative to average national growth (2013-2017)
Finally, only a quarter of counties have their per capita GCP (in real terms) greater than the national GDP per capita (Figure 3). This also highlight huge disparities across counties, but also elevates the opportunity that devolved system of governance brings to table to tackle the same.
Good quality data not only measures progress, but it also inspires it. The World Bank recognizes that availability and access to reliable, credible and timely data is vital to track progress towards our twin goals of ending extreme poverty and promoting shared prosperity. An initiative, such as this – working in partnership with authorities to bridge knowledge gaps – places the World Bank on the global map in terms of innovations that support service delivery, especially in counties in Kenya.
Figure 3: Real GCP per capita (Ksh) relative to the GDP per capita (2017)


Join the Conversation