COVID-19 (coronavirus) has changed the way we live. It brought about human suffering and death and has taken a huge toll on the global economy. As of Nov. 11, 2020, about 51 million cases have been confirmed worldwide, with more than a million deaths.
In addition to strained health systems in many countries around the globe, the COVID-19 pandemic is having unprecedented negative socioeconomic effects on the lives of millions of people, particularly on the most disadvantaged and vulnerable populations. The immediate negative consequences of COVID-19 range from lack of access to food, health and education, to destruction of jobs, loss of income, and deterioration of part of the progress made in terms of living standards over the past decades.
Following the outbreak of COVID-19 and lockdown measures introduced by the government, Statistics Mauritius, the country’s national statistical agency, suspended all field activities related to face-to-face data collection. Statistics Mauritius, financially and technically supported by the World Bank, launched a series of three high-frequency telephone household surveys to monitor the socioeconomic effects of the pandemic on the lives of Mauritian households from May through July 2020.
The three survey rounds capture key information, representative at the national level, about economic activity of individuals aged 16 to 64 years not attending school, access to basic goods and services, food insecurity, changes in household income, shocks and coping strategies. The number of households covered in May, June and July was 924, 907 and 803 respectively, with an average response rate of about 74%. Sex distribution of respondents was close to parity.
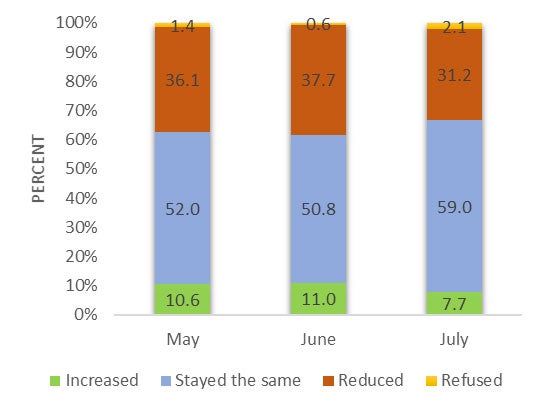
The pandemic has had a negative impact on the income of Mauritian households (Figure 1). In May, about 36% of households reported that their income level had declined since the start of the lockdown, and for half of them income reduced by more than 50%. In June, virtually the same percentage of households (37.7%) reported a reduction in income compared with May. For about 16% of them, income more than halved between May and June. In July, the last month for which data is currently available, the share of households reporting an income reduction relative to June declined to 31%. Yes, the share of households posting an income decline has gone down. Yet, in July for almost one in three households, income declined relative to June.
Figure 1. Changes in household income in May compared with before the lockdown and in June and July compared with the previous month
Why have income levels declined in June and July for almost 1 in 3 households? The data on economic activity collected at individual level throughout the pandemic helps us address this question. There seem to be three key factors.
- Job loss. Although overall employment is gradually bouncing back to the level observed in Q1 2020, wage employment, which includes all workers employed for someone else for pay, including apprentices, is lagging. As of July, wage employment is about 8% below the level estimated in Q1 (about 434,000). And informal employees have suffered more job losses: about 21,000 informal wage jobs have been destroyed between Q1 and July 2020, corresponding to a reduction of 25%.
- Reduction in wages. Wage workers who have maintained their job or have gone back to their job after the lockdown are not making the same money they used to. About 13% of private sector employees reported working shorter hours than usual in July compared with Q1 (Figure 2-panel A). And among them, more than 1 in 2 was paid a fraction of the usual salary in July, up from less than 1 in 3 in May (Figure 2-panel B).
| Figure 2. Changes in labor income among private sector employees | |
a. Share of private sector employees working usual number of hours by survey round |
b. Distribution of private sector employees working shorter hours by extent of salary received and survey round |
 |
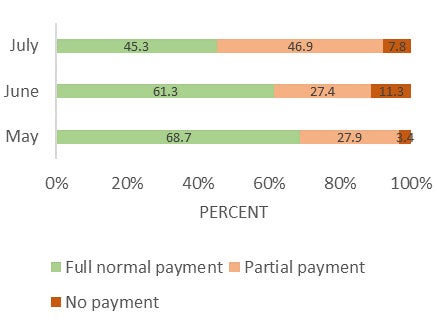 |
- Reduction in business income. Although in July self-employment has returned almost to the level observed in Q1 (about 99,600 vs. 100,600), the share of self-employed reporting a decline in their business income has increased from 75% in May to 84% in July (Figure 3-panel A). With the end of the lockdown, most self-employed have been able to reopen their business. However, more than 9 in 10 make less money in July than they used to because of lack of customers (Figure 3-panel B).
| Figure 3. Changes in labor income among self-employed | |
a. Distribution of self-employed by degree of change in their business income by survey round |
b. Distribution of self-employed by reasons for reporting a decline in business income by survey round |
 |
 |
There are three main strategies that households have adopted since the start of the pandemic: (i) reduction of food consumption, (ii) reliance on savings, and (iii) reduction of non-food consumption (Figure 4). The share of households that have reduced food consumption increased from 27% in May to almost 40% in July. The percentage of households that resorted to savings have reduced from 26% in May to 13% in July as did the share of those that reduced nonfood consumption (from 11% in May to 9% in July). A considerable share of households did not adopt any strategies to mitigate the negative effect of the shocks, and their share increased from 20% in May to 25% in July.
Figure 4. Main strategy adopted by households to cope with main shock by survey round


Join the Conversation