Agribusiness is en vogue, fostered by a new understanding of the agricultural sector as a major contributor to overall growth and poverty reduction and through its linkages with the manufacturing and services sector.
In order to efficiently link farmers and consumers across countries and regions, quantifying and analyzing agribusiness trade flows is key. But how can we measure international agribusiness trade flows in a systematic way to identify important patterns?
Measuring agribusiness trade flows
First, we need an economic framework to help us structure what we want to measure. Despite the recent popularity of agribusiness and its importance as a pillar for development, there is no universal agreement on what activities or products should be subsumed under the term agribusiness. According to the pioneers of agribusiness and so-to-speak creators of the term, John H. Davis and Ray A. Goldberg, it can generally be defined as “the total sum of all operations involved in the manufacture and distribution of farm supplies; production operations on the farms; and the storage, processing and distribution of farm commodities and items made from them” (Davis and Goldberg 1957).
Based on Davis’ and Goldberg’s definition, using the national accounting structure, we depict agribusiness as a set of economic activities in which the agricultural sector overlaps with the manufacturing, services, and other economic sectors. Internationally traded agribusiness relies on various services (e.g. transport, finance, communication) and involves at least basic manufacturing or processing steps. It is a subset of agribusiness.
Source: Mendez and Paustian 2017
Second, to account for the heterogeneity of the agribusiness sector, we distinguish between primary and manufacturing agribusiness products using the Standard Industrial Classification (SIC) system. Primary agribusiness includes 3 categories (agriculture; livestock; forestry), whereas manufacturing agribusiness includes 10 categories to reflect the variety of traded products (canned; cereals; drinks; leather; meat; oils; paper; tobacco; wood; other). We then use the UN Comtrade database to estimate agribusiness trade flows for the defined categories for 184 countries for the period from 1990-2014.
Patterns of international agribusiness trade flows
Our analysis reveals a few interesting patterns:
(1) In absolute values primary and manufacturing agribusiness trade has expanded substantially around the world from 1990 to 2014 – primary agribusiness from $195 billion to $963 billion and manufacturing agribusiness from $498 billion to $2,812 billion of constant 2010 U.S. dollars. However, the shares of primary and manufacturing agribusiness in total trade have been mostly stable during that period, shrinking from 6 to 5 percent and 16 to 14 percent, respectively.
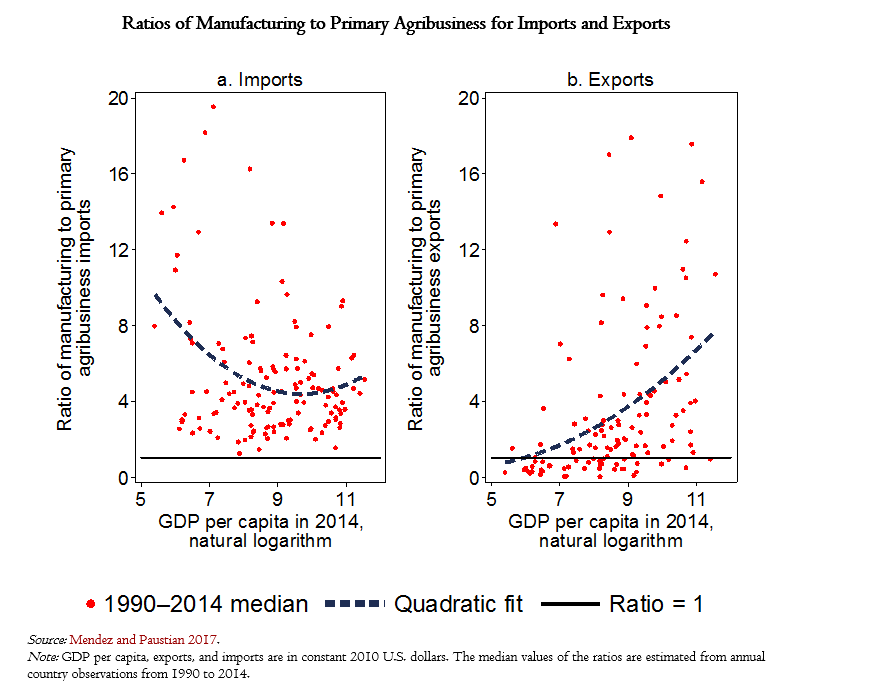
(2) As countries’ income increases, the ratio of manufacturing to primary agribusiness decreases for imports and increases for exports. Therefore, this ratio can be considered as a proxy for the degree of sophistication of agribusiness trade. Whereas the share of primary agribusiness imports in total imports has been small, manufacturing agribusiness imports have played a major role, especially in low-income economies where they have accounted for almost 25 percent of their total imports from 1990 to 2014. Moreover, primary agribusiness exports have been a major component of total exports in low-income countries, greatly exceeding their manufacturing agribusiness exports.
Source: Mendez and Paustian 2017
(3) Trade of manufacturing agribusiness has expanded faster than primary agribusiness, especially in low-income countries. Across all income classifications, the growth rates of imports and exports of all defined categories have been positive indicating the constant expansion of the sector. However, the expansion has been uneven across the different categories and income groups. On average, growth rates in primary and manufacturing agribusiness imports and exports have been higher in low-income countries than in high-income countries or middle-income countries, and lowest in high-income countries. For manufacturing agribusiness for example, oils, meat and cereals exports have increased at annual growth rates of more than 20 percentage points in low-income countries, compared to annual compound growth rates of around 10 percentage points in high-income countries.
Studying agribusiness trade flows and their patterns across countries and regions and understanding the reasons behind those patterns can give governments some indications on major constraints as well as the potential of the sector and its components.
More empirical evidence and analytical work is needed from several angles in order to improve respective policies in the sector. This includes, for instance, the impact of the regulatory framework on agribusiness trade, the role of infrastructure and institutions on the business environment in agriculture and the effects of trade-partner diversification on trade volume and composition. The World Bank’s Enabling the Business of Agriculture (EBA) initiative is an example of an attempt to identify laws and regulations that support agribusiness (see the recently launched Enabling the Business of Agriculture 2017 report).
For more information on internationally traded agribusiness measurement and patterns, please see our recent Research Policy Brief.


Join the Conversation