 Croatia
“Human lives are battered and diminished in many different ways” Amartya Sen, 2000
Many people think of poverty as the consequence of a series of overlapping conditions and circumstances, where deprivations take many forms and stack up to raise a tower of difficulty. They may think about not having enough money to make ends meet, but beyond this poverty could also mean having limited access to education and health services, job prospects, water and sanitation infrastructure, and beyond. A shift in thinking about what poverty measurement actually means in these terms is not new (see OPHI and UNDP, as well as our own work), but taking a multidimensional approach is a welcome addition to the poverty analyst’s toolkit. It has proven to be particularly useful in understanding poverty in Croatia, a high-income European Union country.
Croatia gives municipalities and towns the responsibility of providing key public services. There are 556 municipalities in the country, some with fewer than 300 people and many lacking the capacity to effectively fulfill these responsibilities. The country’s absorption of EU funds has also faced numerous challenges with implications for regional convergence within the country: There is a strong overlap between central and local governments, which limits the implementation of public policies, increases costs, and undermines effective use of resources.
In 2015, the World Bank worked with Croatia’s Central Bureau of Statistics, Ministry of Regional Development and EU Funds, and Ministry of Demography, Family, Youth and Social Policy to provide more evidence on the geographic distribution of poverty. But the exercise did not stop there. The Government of Croatia wanted to use the evidence base to inform the design of policies and the allocation of their budget along with EU funds to promote inclusion and regional development, particularly in deprived areas.
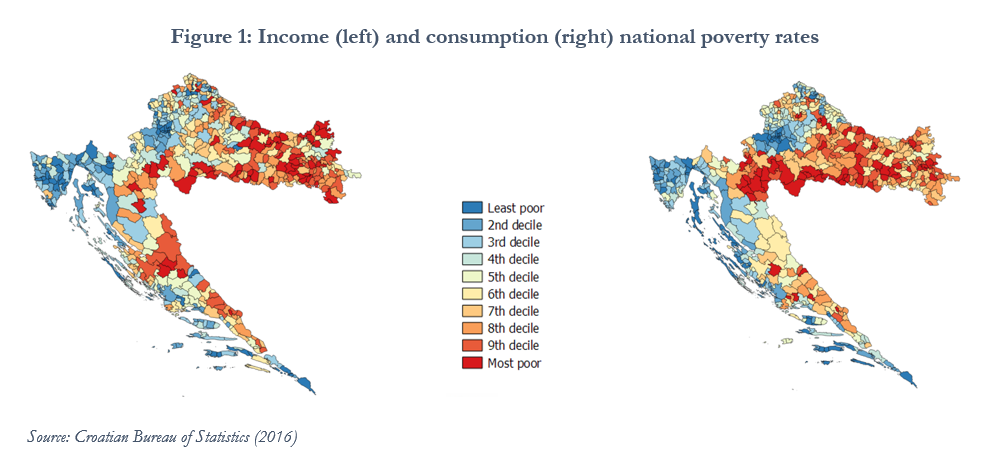
This led to the creation of the Index of Multiple Deprivation (IMD), which gives policy makers a mechanism to align line ministries toward a common goal. The poverty maps for Croatia (Figure 1 – Poverty map) provided the foundation for the IMD, a tool meant to simultaneously address existing vulnerabilities of the population and challenges in effectively reaching those in need. It is of great use for policy making since it assists in identifying, monitoring, and diagnosing lagging regions.
The government of Croatia has already made use of the poverty maps and the IMD to inform a proposal to adjust the country’s regional subdivision. The proposed split would separate Zagreb, the capital, from Slavonia which is in the eastern part of the country. The revision would imply that EU funds could be better targeted to what the evidence at hand points as the poorest area of the country. Additionally, the IMD and the poverty maps have assisted the Ministry of Regional Development and EU Funds in selecting eight cities with very distinct deprivation profiles to benefit from EU-funded revitalization programs.
The index uses information on poverty at the municipal level to inform which indicators of deprivation should be included and how they contribute (provided as a dashboard). Indicators are mapped to sub-domains, and sub-domains are mapped to domains of deprivation (Figure 2 – diagram of IMD indicators). Each indicator, sub-domain, and domain weigh the same (within each level). For example, road density (within the physical infrastructure sub-domain) has an equal weight as all the other indicators within that sub-domain, and the physical infrastructure subdomain carries the same weight as the social services sub-domain under the Access to Services domain. However, social services is composed of three indicators, while physical infrastructure has five. Consequently, any indicator in the social services sub-domain carries a greater weight towards the total IMD, but the Access to Services domain has the same weight as the Economic and Social domains.
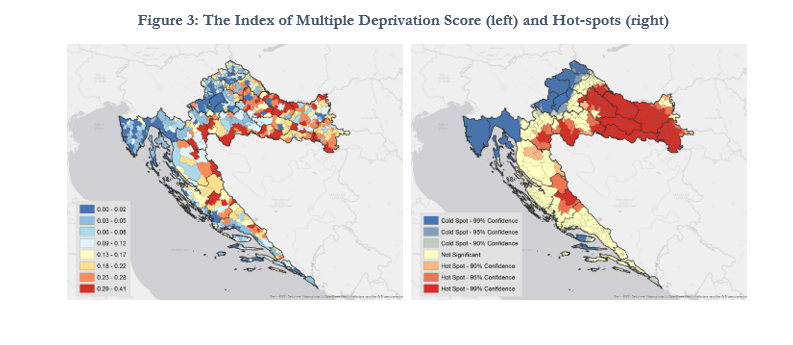
The list of indicators comes from the digital social welfare register (Soc-Skrb) database at the municipal level. The IMD is an aggregate index for different dimensions which is comparable across time where a higher value indicates a higher deprivation (Figure 3 - IMD 2015). Comparability is achieved since values for any indicator today are anchored to the specific indicator’s distribution from 2011 (to overcome issues of dimensionality and temporal comparison). For example, a municipality’s current unemployment rate is compared to the municipal distribution of unemployment in 2011, and if the current value is larger than the median of 2011 it will count as a deprivation.

So, let’s put the tool to the test: assume that the government of Croatia is looking to invest in an education project in Slavonia, one of the poorest regions in the country. In determining which town or municipality in the region it should prioritize, the IMD provides an initial filter (Figure 4 – Dashboard for Slavonia). The figure provides a picture of the poorest and most deprived in Slavonia. Our initial cut-off could be all those towns with a deprivation index above the median, which are excluded. This first filter can be easily checked by other actors engaged in the process, providing transparency. Among the selected localities (Figure 5), it is now straightforward to determine who is in most need of attention. Priority should be given to Otok, Kutjevo, and Pleternica.


In this case, the IMD has provided a simple, transparent, and replicable process to determine who should be given attention in a specific area. The tool is useful for policy makers who want to understand which localities and in what areas they are lagging, or to compare locations. The IMD is a step in the right direction, it adds evidence towards policy and enhances transparency.
Joao Pedro Azevedo, Paul Corral, Sanja Madžarević Šujster, Kenneth Simler, Ljiljana Tarade, Ružica Jugović, Bogdanka, Matea Bošnjak, Vedrana Ligutić, Osman Kaan Inan, Kadeem Ervyn Khan, and Julianna Flanagan are all part of the team that worked on the IMD.


Join the Conversation