 Photo: Maliutina Anna/Shutterstock
The current COVID-19 (coronavirus) pandemic is likely to negatively affect the world’s poor and many of its vulnerable. The long-term effects of this shock could be devastating for many poor and near-poor, not only in terms of immediate health risks, but also in terms of longer-term problems such as stunting and lower human capital accumulation due to increased levels of malnutrition and stress. Rich countries are dealing with the difficult trade-off between lives and livelihoods by allocating unprecedented levels of resources towards cash transfers and expanded unemployment insurance for their citizens, support for businesses to keep their payrolls, and so on. Simultaneously, they are investing in public health efforts, such as improved testing and tracing capabilities, research on vaccines and antivirals, etc. For example, Denmark and the United States have announced emergency spending packages that amount to 10% or more of their respective GDPs (Loayza and Pennings 2020).
Low- and middle-income countries (LICs and MICs) also need massive injections of cash into their economies, but cannot afford the types of measures adopted by high-income countries. Borrowing is less of an option for many of these countries at the moment, as the whole world is going through this negative shock together (there are no other planets to borrow from). One plausible way to finance such support to the world’s poor during what is most likely to be a protracted crisis is redistribution. This blog post imagines a world in which rich countries agree to provide financial support for LICs and MICs during the crisis and outlines the broad strokes of how much such a hypothetical scheme might cost, how it could be financed, who could fund it, and how the money could be distributed across poor countries.
How much will it cost?
The pandemic will affect not only the poor, but also a substantial share of the non-poor. In the United States, 10 million people have filed for unemployment benefits in two weeks that ended on March 28 and news reports suggest that many people are lining up to receive food at local food banks for the first time in their lives. Many of the people who suddenly find themselves in need are not poor, but they are near-poor, in the sense that they have little in the way of savings or assets to buffer themselves and their families from a negative shock. Therefore, it makes little sense to focus on a narrow definition of poor people to assess the need. Here is what we propose (all $ figures that follow are based on purchasing power parity, or PPP):
- Approximately 3.3 billion people (3.386 billion to be precise, 46% of the world’s population) in the world lived below $5.50/day in 2015. Along with the $1.90/day international poverty line used for the Sustainable Development Goals, the World Bank now regularly reports global, regional, and country-level poverty rates at $3.20 and $5.50/day. In our hypothetical scheme to provide emergency relief for the poor wherever they live in the world, we use the highest absolute poverty line that is tracked by the World Bank to include as many poor and vulnerable people as possible. They are least equipped to deal with the crisis on their own and will need assistance over the coming months while the world simultaneously deals with a public health emergency and substantially reduced economic activity.
- Given the size of the shock and agreement among many economists and public health specialists that the recession will not be short-lived (or at least of uncertain duration at the moment), we imagine that the scheme needs to be generous enough to be able to provide, on average, $1.90/day to 3.3 billion people for a period of six months, starting as soon as possible. Such support would need to be worth $ 1.14 trillion.
How can it be financed?
In thinking about how this scheme could be financed, we look at the GDP of the entire G20, which is $ 80 trillion. Emergency relief worth $1.14 trillion accounts for 1.43% of the GDP of G20 and 2.95% of the GDP of the richest ten G20 countries (by GDP per capita). If each country contributed this percentage of their GDP as a one-time relief effort for poor countries, they would be able to assist 3.22 billion people residing in the world’s poorest 66 countries (see Table 1). We discuss the rationale for selecting these countries in the next section.
As you will see, three G20 countries – India, Indonesia, and South Africa – are among the 66 countries that would receive assistance from our imaginary scheme. All three countries would be net beneficiaries (in the sense that transfers to them under our proposed scheme would account for more than 1.43% of their GDP – the proposed contribution of a G20 country). If these three countries received assistance without also contributing, the share of contributions from the remaining 17 countries would increase to 1.66%. One could also easily imagine a scheme that is progressive in its design, where the richest countries in the world (in GDP per capita terms) would provide a higher percentage of their GDP, reducing the burden on the emerging economies in G20.
If we were to limit the list of countries eligible for assistance to IDA and IDA blend countries (see Table 2), the amount needed to reach the same poverty gap target as that in the proposal above would be $600 billion, or 0.76% of the GDP of G20. Limiting the transfers to IDA and IDA blend countries would rule out transfers to G20 countries like India, Indonesia, and South Africa. If those three countries were exempted from contributing, the percentage of GDP contribution would rise to 0.88% for the remaining countries.
Given that the COVID-relief bill that was passed by the United States congress is equal to approximately 10% of the country’s GDP and that spending bills in other high-income countries are equally costly (the EU and its member states are reported to be mobilizing 2% of EU GDP in fiscal measures and 13% of EU GDP in liquidity support), a marginal increase of approximately 0.75 to 1.5% of GDP devoted to emergency spending in the poorest countries of the world seems like a small price to pay for G20 countries – given that the whole world needs to suppress the coronavirus to get back to some sort of normalcy, as opposed to each country dealing with the problem within its own borders.
For comparison, a $1.14 trillion aid package to world’s poorest 66 countries (or the $0.6 trillion package to IDA & IDA blend countries) would amount to 35.8% (15.8%) of the income of the top 1% in the United States. It would constitute only 4.0% (1.8%) of the wealth of top 1% in the United States and 63.5% (28%) of the wealth of the world’s 50 richest people. The Economist reports that IMF estimates emerging markets to need at least $2.5 trillion over the course of the pandemic. Landais, Saez, and Zucman have recently proposed a progressive wealth tax in Europe to fund the COVID response. Similar calls for financing additional expenditures in emerging economies and poor countries are being made as we write: see, for example, the call for the G20 to coordinate such a response through an Executive Task Force as part of the G20 Action plan here, and for India to finance additional expenditures roughly equivalent to 5% of its GDP here (ungated).
Our main aim here is to imagine a larger scheme for LICs and MICs than those that have been discussed so far in the development community and to guide the allocation of financial support between countries using an optimal poverty reduction scheme for a given budget – based on our poverty lines and using distributional data in PovcalNet. We are not prescriptive on within-country targeting, about which a vigorous discussion can be had. Our suggestions are on overall budget and inter-country allocation. We are also silent on the governance and corruption issues that a massive relief effort might bring to the fore.
How did we construct the list of 66 poorest countries in the world?
The marginal value of a dollar transferred is higher for the poorest among the poor and vulnerable. Therefore, we want to minimize a poverty index that is distribution-sensitive, namely the squared poverty gap index (or the Foster-Greer-Thorbecke index with α=2, or FGT(2))1. Using a well-known result in optimal geographic targeting to minimize poverty (Kanbur, 1987) given a fixed budget, we propose allocating our budget by ranking all countries in the world using their poverty gap index, i.e. FGT(1), and making a lump-sum transfer to the poorest country that equalizes its poverty gap to that of the second poorest country by allocating the transfer equally and universally among all of its citizens; making lump-sum transfers to those two countries enough to bring their poverty gap index equal to the third poorest country, and so on – until the budget of PPP$1.14 trillion is exhausted. This process produces a list of 73 countries with post-transfer poverty gaps in excess of 0.133 (i.e. the mean income among the poor being 13.3% below the $5.5/day poverty line). For seven of these countries, the transfers they would receive is small at less than 1.43% of their own GDP, which is the share G20 countries are being asked to contribute. We exclude these countries from our list of poorest countries eligible to benefit, leaving 66 countries.
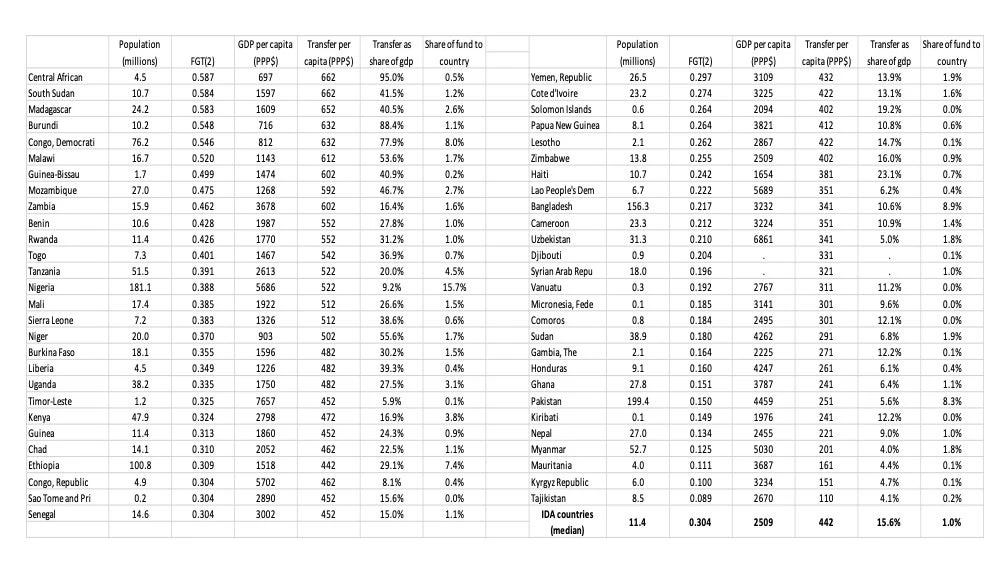
Table 1 shows the list of 66 countries, ranked by their FGT(2) estimates (in 2015, using poverty line of $5.5 per day) from PovcalNet, how much they would receive under our optimization scheme, what share of their GDPs the transfers amount to, and the share of the budget that is going to that country. You can see, for example that the per capita transfer amount ranges from $110 to $662, with a median transfer of $412 per capita. A per capita $662 allocation would be sufficient to provide everyone with $1.90/day transfers for almost an entire year. We can see that India, to which 37% of the funds would be flowing under our optimization scheme, would receive $321 per capita, sufficient to offer everyone $1.90 per day for almost six months. No other country receives more than 10% of the budget. India, Nigeria, Indonesia, Bangladesh, and Pakistan are the five countries receiving the highest shares of the budget (Figure 1), followed by DRC, Ethiopia, Tanzania, Kenya, and the Philippines. Interestingly, the median country assistance accounts for 12% of GDP (Figure 2) – a share that is very similar in relative magnitude to the emergency spending legislations passed in high-income countries like United States or the EU. With 0.75-1.5% of the GDP of G20, it is possible to provide emergency relief of similar proportion to the poorest countries that are home to more than 40% of the world’s population.
Table 1
Figure 1
Figure 2
Table 2 presents the same information for 55 IDA and IDA blend countries. There are 11 IDA countries with poverty gaps that are below the post-transfer poverty gap of 0.133 used in our global calculation, which are therefore excluded from this list. The assistance to this group is less costly because large countries like India and Indonesia are not among this group. This also makes the allocation of the budget between countries less unequal (Figure 3). The largest share of the budget accruing to a country is equal to 15.7%, compared with the 37% of the budget allocated to India when non-IDA countries are included. The median transfer for the 55 IDA countries equals PPP$442 per capita (compared with $412 above) and 15.6% (significantly higher than the 12% figure above) of national GDP (Figure 4).
Table 2
Figure 3

Figure 4

Our hypothetical scheme does not consider the beneficiary countries’ own capacity for redistribution. Surely, a non-negligible share of these countries does redistribute – through progressive social safety net schemes targeting the poor. Furthermore, some countries do not have the fiscal space for poverty reduction through redistribution. But, it is also the case that some countries have the capacity and could redistribute more on their own. Ravallion (2010) discusses this issue (ungated here). Any real-world discussions would likely need to take this consideration into account before determining the required budget, shares accruing to each beneficiary country, etc.
Conclusion
As $1.9/day per person for six months would constitute generous hypothetical transfer amounts (compared with existing social safety net programs in LMICs), a non-negligible share of the aid could be directed by each country towards urgent public health investments, which could be paired with technical assistance from high-income countries, international financial institutions, and the World Health Organization. We suggest that the remaining sums should be prioritized to establish or support existing transfer programs in each country – universal or targeted as appropriate to the setting in each country. Such support could shield residents of poor countries, especially vulnerable populations, such as pregnant women, families with young children, and the elderly, from destitution, malnutrition, and poor health, and prevent irreversible long-term harm from the pandemic.
The reader should note the following caveats regarding the data underlying this exercise and our simulations:
- While the total budget is equivalent to giving 3.3 billion people a daily transfer of PPP$1.90, beneficiary countries receive different amounts – with poorer countries receiving much more than less poor ones.
- The poverty gap figures available to us from PovcalNet are pre-pandemic values (centered around 2015), using the best data available to us from before the onset of the crisis. These pre-crisis poverty estimates are simply used as a tool to discipline our targeting scheme: counterfactual ex-post poverty gaps could be such that a substantial reranking of countries might occur based on the severity of the crisis in each country.
- The 66 countries targeted by the scheme proposed here are the poorest countries for which we have data, i.e. excluding countries such as North Korea or Somalia for which we have no survey data that could be included.
- The poverty estimates in the tables and figures are the estimates for the reference-year 2015. Since many countries do not have household surveys every year, it is often necessary to extrapolate or interpolate the welfare aggregate(s) of the closest survey year(s) to a common reference year, in order for poverty to be estimated across all countries at the same time. These extrapolations and interpolations to the reference years require additional assumptions, namely that (a) growth in the household income or consumption can be approximated by growth in national accounts and (b) all parts of the distribution grow at the same rate (methodological details can be found in Chapter 6 and Data Appendix).
- You can replicate our exercise or adapt it as you wish using our code here. The simple method that we use to calculate the poverty gap after uniform transfers is described here.
For readers interested in the implementation of cash transfers to large shares of the population, see Ugo Gentilini’s Weekly Social Protection Links here, and his living paper (with Almenfi and Orton) on Social Protection and Jobs Responses to COVID-19 here – updates and new versions are available every Friday. See also this blog by Rutkowski et al. on government-to-person payments and the myriad ways governments are tackling this issue. Finally, our research group has an eSeminar series on Development Policy and COVID-19, which has a session devoted to this topic on April 20. Please see the schedule (and join us) here.
We are grateful to the following people for useful feedback, without implicating them in any way: Pierre Bachas, Francisco Ferreira, Chisako Fukuda, Emanuela Galasso, Ugo Gentilini, Margaret Grosh, Aart Kraay, Norman Loayza, Steven Michael Pennings, Martin Ravallion, Carolina Sanchez-Paramo, and Sergio Schmukler. All errors are ours.
1 For a discussion of the FGT class of poverty measures, see, e.g., this paper by Elbers et al. (2007).


Join the Conversation