There is a lot of public discussion about Thomas Piketty’s book on capital and its implications for inequality. His work strikes a chord with many of us because it outlines a future where basically your own or inherited wealth matters and where wage income and apparently your human capital does not matter that much for your income generation. So how do we escape such a one-sided and unequal world? Well, maybe one way is to understand better the interaction between growth, changes in the income distribution, and their implications for shared prosperity.
Why? Because, in some cases, the dynamic development process, of which income growth is an integral part, appears to be reducing inequality and assisting the growth in income of the extreme poor (those living under $1.25 a day) and the poor (the bottom 40 percent), while in other cases it does not and the answers are not that easy to get as, not surprisingly, the answers most likely depend, to a large extent, on the country context.
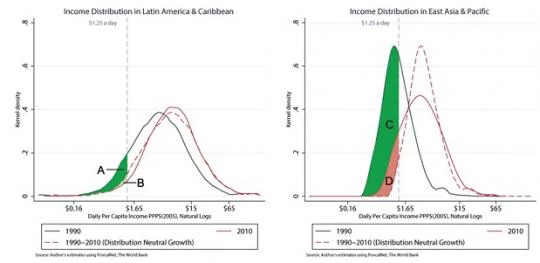
A visualization of these changes, using figures of income distributions, can be very helpful as a means of analyzing what has so far happened. The two charts depict income distributions in Latin America & the Caribbean (LAC) and East Asia & the Pacific (EAP) regions using 1990 and 2010 data from Povcalnet. The charts show very different shapes and movements over time.
Using the 1990-2010 cumulative growth rate of each region, if we shift the 1990 income distribution to the right, we find that growth affects everybody equally (see the striped red line in the two charts), thus, graphically demonstrating how much of the extreme poverty reduction is due to cumulative regional growth and how much is due to changes in the regional income distribution. Note that extreme poverty reduction from 1990 to 2010 in the chart for LAC consists of the sum of the areas A and B and, for EAP, of the area C.
In the case of LAC, one can see that the changes in the shape of the regional income distribution between 1990 and 2010 favored extreme poverty reduction. Regional growth with the same regional income distribution would have reduced extreme poverty by the people covered by area A, while the change in the income distribution favored the extreme poor and added the people covered by area B.
In the case of EAP, the opposite happened. Regional growth with the same regional income distribution as in 1990 would have reduced extreme poverty by the people covered in the areas C and D. However, the actual change in regional income distribution in EAP was not favorable for extreme poverty reduction and, hence, the people covered by area C escaped extreme poverty between 1990 and 2010.
In numbers, EAP lifted approximately 675 million people out of extreme poverty and LAC about 21 million. Obviously we need to check for population size, but, nevertheless, progress in EAP is impressive by any standard as the region reduced its poverty headcount from 56.2 percent to 12.5 percent of its population, while the LAC region which had a much more favorable starting position reduced extreme poverty headcount from 12.2 percent to 5.5 percent. For LAC, this is particularly remarkable as reducing extreme poverty, when it is almost in the single digits is more challenging than when extreme poverty is still rather large (see previous blog).
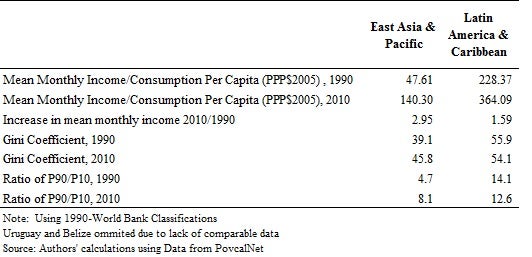
An important challenge for all of us will be to understand the differences in policies and institutions and/or initial conditions that led to interaction between growth and changes to the income distribution in LAC to reinforce extreme poverty reduction more than, for example, in the EAP region. Thinking through this should really help us go forward with The World Bank Group’s goals of ending poverty and boosting shared prosperity. Do we have the answers? Not yet, but one can expect that social safety nets, job creation, initial inequality, initial income levels, and growth might all have something to do with it (see Table). 


Join the Conversation