
Geographically and historically, Azerbaijan has often been at the crossroads: of trade routes, cultures, and influences. From a telecom policymaking standpoint, the country is currently at another important crossroad - this time having to choose from available regulatory approaches designed to pave the way for the high-speed broadband roll-out across the country.
Which regulatory framework is best to follow? Which country experience is closest to the needs of the Azerbaijani population and could provide for not only rapid but, more importantly, self-sustaining broadband market development?
Over the last year I had a chance to analyze the Azerbaijani broadband market, with my objective being the formulation of advice on the best way to stimulate the broadband market growth. In this blog I would like to briefly outline two relevant models of fixed broadband market development, either of which, from a quick glance, could be considered appealing for Azerbaijan because of a positive market growth trajectory and low consumer prices (the full analysis will be published soon). The models I am referring to are competition-led and government-led market development approaches, in the analysis they are represented by experiences of two oil-exporting economies, similar to Azerbaijan - Norway and Qatar.
Here are some basic fixed broadband connectivity data for Azerbaijan, specifically related to penetration, coverage growth and quality of service:
- Number of Internet users: 73 percent (2013)
- Fixed broadband penetration on a household level: 30.26 percent (2013)
- The lowest priced fixed broadband package as a share of average disposable monthly income: 13.82% (April 2014)
- Average connection speed: 2,868 Kbps (Q4 2013)
- Number of higher speed connections (over 4Mbps) as a share of all Internet connections: under 10 percent
- Herfindahl-Hirschman Index (fixed broadband market): 3443 (1Q 2014)
Two development paths, two different results stories
At first glance, both Norway and Qatar perform equally well on the major broadband market indicators when compared to their respective regional peers. In Norway, mobile broadband penetration per capita stands at 113 percent as of end-2013, and in Qatar, the penetration is 79 percent. During the same time period, fixed broadband household penetration in Norway reached 83.88 percent while in Qatar this figure was 68.67 percent.
Remarkably, both countries demonstrate a very high level of affordability of fixed and mobile broadband packages for an average consumer: a member of a household in Qatar spends 1.69 percent of their monthly disposable income on fixed broadband connectivity and 0.37 percent on a similar mobile broadband package. A member of an identical household in Norway spends even less: 0.77 percent of their average monthly disposable income on fixed broadband and 0.26 percent on mobile broadband.
The same cannot be said, however, about the level of sector competition and broadband adoption. While outperforming other Gulf economies on a number of broadband market indicators, Qatar has been largely underperforming when compared to Norway with regards to the promotion of competition in the telecom sector, which could be attributed to a state-led market development approach in telecom policymaking.
Norway, on the other hand, has stimulated a high level of infrastructure-based competition by adopting the European Union’s telecom regulatory framework. Whereas Qatar has a largely state-dominated market with two Internet Service Providers (ISPs) - a state-owned incumbent and a semi-private telco - Norway boasts 150 competitors on its market, all of whom are private entities. Here are the number of ISPs and market share of alternative players in Norway vs. Qatar, according to World Bank data, as of December 2013:
Norway:
Number of ISPs: 150
Number of households per ISP: 15,333.33
Market share of the second-biggest ISP: 17.0%
Cumulative market share of alternative operators: 55.2%
Qatar:
Number of ISPs: 2
Number of households per ISP: 150,000
Market share of the second-biggest ISP: 2.4%
Cumulative market share of alternative operators: 2.4%
In terms of other parameters, a Norwegian ISP services around ten times fewer households than a Qatari ISP. The market share of the second biggest ISP in Norway is almost eight times higher than that operating in Qatar, and the cumulative market share of Norwegian alternative operators is over 25 times bigger than the cumulative market share of a Qatari competitor to the state incumbent.
On a competition continuum between Norway (full competition telecom sector) and Qatar (closed competition telecom sector), Azerbaijan is somewhere in the middle, yet leaning more towards the latter. Although there are several dozen private ISPs functioning in the Azeri market, their ability to penetrate the market is to a certain extent hampered by the existing regulatory framework giving the nod to state-owned enterprises.
Striving for a higher level of competition should be not only for the sake of achieving a lower market concentration or a higher ranking on an authoritative international ICT benchmark. Competition is a critical factor for achieving diversity and affordability of broadband services, which was confirmed by the analysis performed. For instance, in terms of the service quality, Norway (with low market concentration) shows higher technological diversity (inter-platform competition) as benchmarked against countries with a higher market concentration (see Figure 1).

in benchmark countries, 2008-2013
The higher quality of services in Norway is evidenced by a high average connection speed (Figure 2), high broadband adoption (Figure 3), and significant international Internet bandwidth per user (Figure 4).
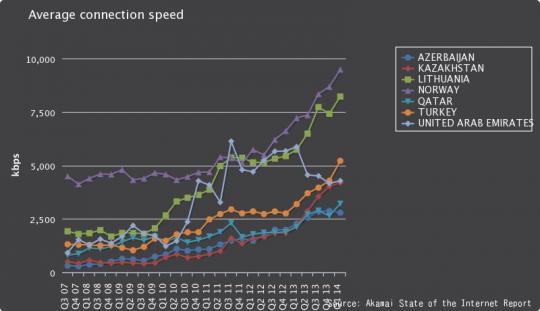
Q3 2007 – Q1 2014.
Source: Akamai, “The State of the Internet.”

Q3 2007 – Q1 2014.
Source: Akamai, “The State of the Internet.”

vs. benchmark countries, 2013
Lessons learned for Azerbaijan
Analyzing a country’s broadband development without putting it into perspective against relevant country comparators is often a futile exercise. Comparing Azerbaijan to similar oil-exporting economies is useful for discerning how remarkable telecom policy results could be reached in a sustainable manner through open market mechanisms. A bottom line is that while a rapid broadband penetration growth and uptake of broadband services can be achieved with mainly government financial support, the quality of these services cannot be retained at the anticipated high level, unless proper regulatory conditions have been created to enable telecom sector competition, which subsequently pushes for greater service adoption.
To date, Azerbaijani policymakers have been deliberating establishment of a national program that would secure infusion of a significant amount of government funding (around US$550 million) into the fixed broadband infrastructure deployment in the underserved areas of the country. It is rightly understood that the new generation technology broadband infrastructure is a prerequisite for growth of not only of the ICT sector, but of economy, as a whole. Yet international experience shows that the state aid principles should be applied selectively, in other words, only in those geographical areas where the private sector would not address connectivity gaps due to an unviable business case.
Although important for the development of a broadband market, government interventions alone are unlikely to be enough. Public investment interventions should be supported through design and adoption of a proper regulatory telecom framework pivoted on the promotion of competition, which would allow for a higher return on public investment. Otherwise, a country risks receiving the state-of-the-art broadband infrastructure at a cost that is not recoverable even in the long term.
- You can read our sector assessment by visiting this feature story: Accelerating the Growth of High-Speed Internet Services in Azerbaijan


Join the Conversation