In an office building in Silicon Dar, the bustling technology district in Tanzania’s capital, Dar es Salaam, 50 university students are using cutting-edge artificial intelligence (AI) methods for an unusual purpose: mapping the city’s trees.
Urban trees bring enormous benefits to city neighborhoods: They reduce heat stress, alleviate air pollution, and absorb stormwater that can cause devastating floods.
Dar es Salaam is among dozens of cities globally to adopt new strategies, guidelines and targets to integrate green spaces and urban forestry into its urban fabric. And yet the most basic data required to plan and implement urban greening campaigns — namely a map of the city’s existing tree cover — has remained elusive for all but the highest-income cities that can afford city-wide campaigns to count individual trees or map them with expensive light detection and ranging (LiDAR) cameras mounted on airplanes or drones.
However, new technologies may be about to change that, and the Global Facility for Disaster Reduction and Recovery (GFDRR) is actively supporting that change. Using the latest machine learning technology, participants in Tanzania’s Resilience Academy (as part of a pilot program funded by GFDRR) helped build a comprehensive map of the city’s trees while deepening their skills in one of the tech world’s fastest-growing market niches: the data labeling industry.
Urban greening: economics and equity
From Mexico City’s Plan Verde to Sierra Leone’s Freetown the Treetown initiative, cities around the world have stepped up ambitious urban greening initiatives in recent years: building large and small parks, planting millions of trees, and engaging citizens and businesses in maintaining green assets on street corners, traffic circles, backyards, and private properties.
The reason is simple: City trees provide vast economic benefits. By putting a price tag on impacts such as stormwater absorption, analysts have estimated a return of at least $2.50 for every $1 invested in greening programs. And that is before considering well-proven associations of green city spaces with reduced crime, improved student learning, and flourishing commercial districts.
But in Dar es Salaam and many other cities, poorer neighborhoods tend to have less vegetation and tree canopy around them. Take Namanga, a densely packed informal settlement in eastern Dar es Salaam. Despite abutting some of the city’s wealthiest and greenest neighborhoods, residents of Namanga must endure weather extremes with barely any green cover to provide shade or absorb run-off from sudden downpours.
Tree-cover maps with AI
Understanding which districts have ample or inadequate tree canopy cover is challenging but it is becoming more feasible due to increasingly detailed satellite imagery.
Machine learning algorithms are a key technology for interpreting such imagery. Still, algorithms to detect features such as tree canopy are only as good as the data they are built on. When our team applied an off-the-shelf tree detection algorithm (developed using a tree canopy dataset from California) to satellite imagery of Dar es Salaam, the results were unsatisfactory.
Data labeling is the process of adding meaningful information to raw data so that computers can learn to recognize patterns in it, for example, annotating recordings of human speech with the words they contain or identifying objects in photographs.
To produce detailed tree-cover maps of Dar es Salaam and Freetown, the capital of Sierra Leone, the Resilience Academy students began by developing their own large dataset of labeled satellite imagery.
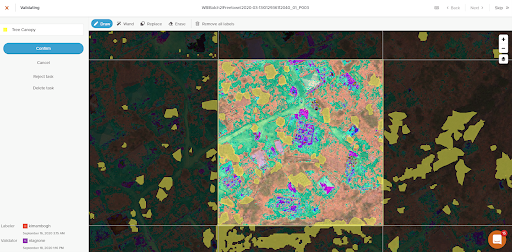
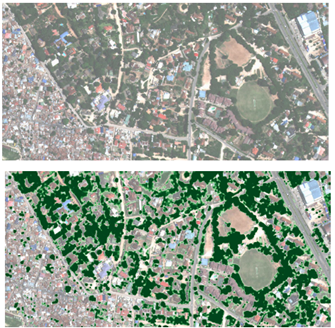
Using an open-source labeling tool developed by Azavea, the students loaded high-resolution satellite imagery, divided it into grid cells, and drew accurate boundaries around the tree canopy. By labeling just 1% of the city in this way, the resulting dataset enabled a machine learning model to learn how to recognize its trees, distinguishing tree canopy from grass, buildings and other features, even in shady conditions.
Urban resilience, digital jobs
The full tree canopy map for Dar es Salaam can be viewed at this link. Exploring the detailed tree-cover map allows urban planners and citizens to quickly visualize the significant inequities in green assets across the city: Tree canopy makes up more than 20% of the surface area of prosperous neighborhoods but less than 0.5% in poor neighborhoods like Namanga.
The project helped students learn about greening issues and be part of the solution for participants in the Resilience Academy. Moreover, working with machine learning opens the doors to jobs and earning opportunities. Data labeling has become one of the fastest-growing segments of the global AI market, creating tens of thousands of jobs in low- and middle-income countries and revenue projected to exceed $1 billion by 2023.
Working with the European Space Agency, our team at GFDRR is expanding canopy mapping to additional cities. Tree canopy maps are just a starting point toward sustainable urban greening. But thanks to new technologies combined with local knowledge of Resilience Academy participants, they can help city leaders make decisions about urban greening investments with additional confidence.


Join the Conversation