This blog is part of a series produced to commemorate End Poverty Day (October 17), focusing on China – which has contributed more than any other country to global poverty reduction – and its efforts to end extreme poverty by 2030. Read this blog series.
Reducing poverty and inequality are two important socioeconomic policy objectives for most countries. While some can kill two birds with one stone, others may achieve either or none of these. In China’s special case, poverty reduction goes together with an increase in income inequality for at least the past 20 years. Here, I address some of the underling factors in this mismatched trajectory.
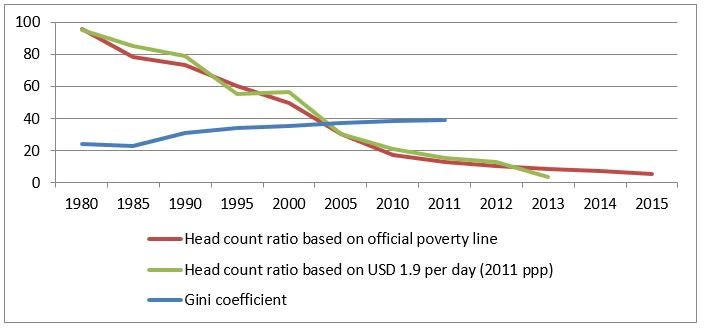
For quite a long time, economic growth, increase in income inequality and reduction of poverty concurred in China. Since 1980, the country has made remarkable progress in reducing poverty. The head count ratio of poverty by the official poverty line, which is about 21% higher than the line that is set at USD 1.9 per day (2011 PPP), has been reduced by 94% from 1980 to 2015 in rural China (figure 1).
In contrast, the Gini coefficient of income distribution among rural residents in China rose from 0.241 in 1980 to 0.39 in 2011 or by 62% according to the official estimation, though it once declined between 1980 and 1985 and was said to decline slightly after 2012.
Figure 1: Change in Poverty head count ratio and Gini coefficient in rural China since 1980
 Sources: China National Bureau of Statistics (2015), Poverty Monitoring Report of Rural China, China Statistics Press; the data for poverty by USD 1.9 per day is from PovcalNet: the online tool for poverty measurement developed by the Development Research Group of the World Bank.
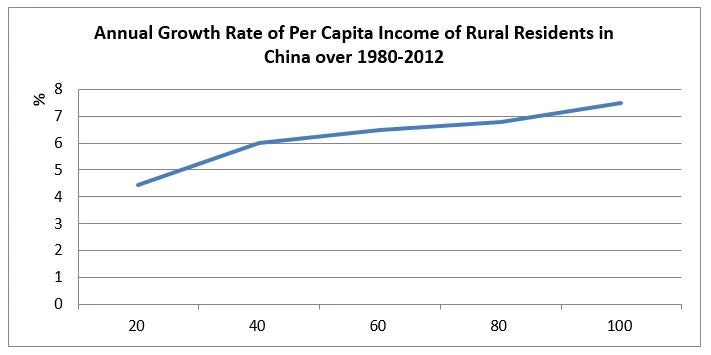
The immediate reason underlying the mismatched change in poverty reduction and income inequality in rural China, however, is not difficult to understand using the growth incidence curve presented in figure 2. In the 32 years between 1980 and 2012, per capita net income among the rural population rose by an annual average of 6.9%. During the period, the income for the bottom 20% and 40% households increased 4.5% and 6% annually respectively, while the top quintile household increased their income at an annual rate of 7.5%.
Figure 2: Growth incidence curve of income per capita in rural China over 1980-2012
 Source: Author’s own calculation based on data released by the National Bureau of Statistics. China National Bureau of Statistics (2010), China Yearbook of Rural household Survey, China Statistics Press and http://data.stats.gov.cn/easyquery.htm?en=C01.
Note: The income for varied income groups in 1980 is calculated by author using the household data of 20 sub-groups. It is assumed the income of households within the last sub-group is of no difference when dealing with the situation where the accumulated household percentage did not stand right on the cut-off lines for 20 sub-groups. This definitely overestimates the income of the lower income groups.
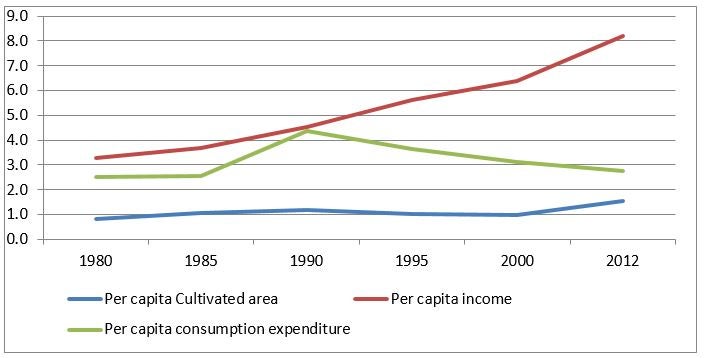
The difference of income growth between bottom and top quintile households over the period led to their ratio of income per capita of the top quintile against that for the bottom rising from 3.3:1 to 8.2:1(figure 3). It is clear that the marked reduction of poverty in rural China is because the bottom households increased their income at a high annual rate over a quite long time. On the other hand, income inequality had been rising largely because the top quintile households had increased their income much faster than their poor counterparts.
Figure 3: Change of top-bottom quintile ratio in land, income and consumption over 1980-2012.
 Sources are the same as those for figure 2.
But how did the bottom 60% of households in rural China increase their income at a considerably high rate over such a long period? There are at least four factors underlying the income growth of the poor.
First, the benefits of China’s sustained economic growth have really trickled down. Accelerating industrialization and urbanization in a country of over one billion people has transformed a large number of the agricultural surplus labor in the countryside into urban employment in China.
Between 1978 and 2015, the number of people in nonfarm jobs as a percentage of total employment increased from 29% to 70%. This change also occurred in poor areas and to poor households. Official data indicates that, while the number of those that moved away for nonfarm jobs out as a percentage of the total size of the local labor populations was slightly lower in poverty-stricken areas than in the nation as a whole, the gap between the growth rates of the number of people shifting to nonfarm jobs in poor areas and in the nation as a whole was reduced to close to zero for the 1996-2009 period. Between 2002 and the end of 2012, earnings from wage and salaries as a percentage of total household income rose from 26% to 43% for rural households in the bottom 20 percentile, at a rate that was roughly comparable to the national average. Evidently, low-income rural households have benefitted proportionally from the changes in the country’s employment pattern engendered by the dual process of industrialization and urbanization.
Second, the system of land ownership has notable consequences for both the occurrence and the mitigation of poverty in rural China. The distribution of cultivated land in rural China has been quite equal with bottom quintile households owning about 90% of land areas as the top quintile owned, much more equal than those for income and consumption per capita (figure 3). On average, each of the bottom quintile households owned 0.6 hectare of cultivated land. The relatively equal distribution of land enables the bottom poor to proportionally benefit not only from development and reform in agriculture but also from the transfer payments the state provided to support agricultural development.
Third, universal social development programs made contributions to the income growth of the bottom households. China has implemented a couple of social development programs in rural areas since 2000, including universal compulsory education up to grade 9, rural medical cooperative system, social pension system for rural residents, and a minimum living allowance scheme. With these programs in place, low income households secured a share of benefits larger than their part in other sources of income, which helps the poor increase their disposable income at a higher rate than that for their productive income. Official data indicates that increased transfer income for the bottom quintile households between 2002 and 2012 contributed 21% of their increased disposable income during the period.
Last, but not least, targeted poverty reduction programs, in place nationally since 1986, played an important role. The Chinese government launched a package of targeted poverty reduction programs covering broad areas, from physical infrastructure, social development, to industrial development and income generation to assist poor households and poor areas and improve their ability to share the benefits of national growth and generate more income by themselves. An incomplete official statistic shows that earmarked funding input from central government totaled 469 billion yuan(about USD 70 billion) between 1980 and 2016.
Given the central government’s commitment to ending extreme poverty by 2020, one can gather that going forward these programs will make a larger contribution to poverty reduction in China, with the introduction of more precise poverty reduction interventions.
Reducing poverty and inequality are two important socioeconomic policy objectives for most countries. While some can kill two birds with one stone, others may achieve either or none of these. In China’s special case, poverty reduction goes together with an increase in income inequality for at least the past 20 years. Here, I address some of the underling factors in this mismatched trajectory.
For quite a long time, economic growth, increase in income inequality and reduction of poverty concurred in China. Since 1980, the country has made remarkable progress in reducing poverty. The head count ratio of poverty by the official poverty line, which is about 21% higher than the line that is set at USD 1.9 per day (2011 PPP), has been reduced by 94% from 1980 to 2015 in rural China (figure 1).
In contrast, the Gini coefficient of income distribution among rural residents in China rose from 0.241 in 1980 to 0.39 in 2011 or by 62% according to the official estimation, though it once declined between 1980 and 1985 and was said to decline slightly after 2012.
Figure 1: Change in Poverty head count ratio and Gini coefficient in rural China since 1980

The immediate reason underlying the mismatched change in poverty reduction and income inequality in rural China, however, is not difficult to understand using the growth incidence curve presented in figure 2. In the 32 years between 1980 and 2012, per capita net income among the rural population rose by an annual average of 6.9%. During the period, the income for the bottom 20% and 40% households increased 4.5% and 6% annually respectively, while the top quintile household increased their income at an annual rate of 7.5%.
Figure 2: Growth incidence curve of income per capita in rural China over 1980-2012

Note: The income for varied income groups in 1980 is calculated by author using the household data of 20 sub-groups. It is assumed the income of households within the last sub-group is of no difference when dealing with the situation where the accumulated household percentage did not stand right on the cut-off lines for 20 sub-groups. This definitely overestimates the income of the lower income groups.
The difference of income growth between bottom and top quintile households over the period led to their ratio of income per capita of the top quintile against that for the bottom rising from 3.3:1 to 8.2:1(figure 3). It is clear that the marked reduction of poverty in rural China is because the bottom households increased their income at a high annual rate over a quite long time. On the other hand, income inequality had been rising largely because the top quintile households had increased their income much faster than their poor counterparts.
Figure 3: Change of top-bottom quintile ratio in land, income and consumption over 1980-2012.

But how did the bottom 60% of households in rural China increase their income at a considerably high rate over such a long period? There are at least four factors underlying the income growth of the poor.
First, the benefits of China’s sustained economic growth have really trickled down. Accelerating industrialization and urbanization in a country of over one billion people has transformed a large number of the agricultural surplus labor in the countryside into urban employment in China.
Between 1978 and 2015, the number of people in nonfarm jobs as a percentage of total employment increased from 29% to 70%. This change also occurred in poor areas and to poor households. Official data indicates that, while the number of those that moved away for nonfarm jobs out as a percentage of the total size of the local labor populations was slightly lower in poverty-stricken areas than in the nation as a whole, the gap between the growth rates of the number of people shifting to nonfarm jobs in poor areas and in the nation as a whole was reduced to close to zero for the 1996-2009 period. Between 2002 and the end of 2012, earnings from wage and salaries as a percentage of total household income rose from 26% to 43% for rural households in the bottom 20 percentile, at a rate that was roughly comparable to the national average. Evidently, low-income rural households have benefitted proportionally from the changes in the country’s employment pattern engendered by the dual process of industrialization and urbanization.
Second, the system of land ownership has notable consequences for both the occurrence and the mitigation of poverty in rural China. The distribution of cultivated land in rural China has been quite equal with bottom quintile households owning about 90% of land areas as the top quintile owned, much more equal than those for income and consumption per capita (figure 3). On average, each of the bottom quintile households owned 0.6 hectare of cultivated land. The relatively equal distribution of land enables the bottom poor to proportionally benefit not only from development and reform in agriculture but also from the transfer payments the state provided to support agricultural development.
Third, universal social development programs made contributions to the income growth of the bottom households. China has implemented a couple of social development programs in rural areas since 2000, including universal compulsory education up to grade 9, rural medical cooperative system, social pension system for rural residents, and a minimum living allowance scheme. With these programs in place, low income households secured a share of benefits larger than their part in other sources of income, which helps the poor increase their disposable income at a higher rate than that for their productive income. Official data indicates that increased transfer income for the bottom quintile households between 2002 and 2012 contributed 21% of their increased disposable income during the period.
Last, but not least, targeted poverty reduction programs, in place nationally since 1986, played an important role. The Chinese government launched a package of targeted poverty reduction programs covering broad areas, from physical infrastructure, social development, to industrial development and income generation to assist poor households and poor areas and improve their ability to share the benefits of national growth and generate more income by themselves. An incomplete official statistic shows that earmarked funding input from central government totaled 469 billion yuan(about USD 70 billion) between 1980 and 2016.
Given the central government’s commitment to ending extreme poverty by 2020, one can gather that going forward these programs will make a larger contribution to poverty reduction in China, with the introduction of more precise poverty reduction interventions.


Join the Conversation